
The results of an extensive survey that asked Brits about their recent experience of suspicious phone calls and messages were published last week to little fanfare. That is a shame, because the survey offered deeper insights than the usual headline-grabbing clichés about fraud being bad and getting worse. The survey was commissioned by Ofcom, the UK comms regulator, and involved 2,202 Brits who were chosen to be representative of the entire UK population based on age, gender, ethnicity, region, social class, working status and housing tenure. They were each asked 48 detailed questions about voice calls, SMS messages, and messages received through apps, primarily to assess the extent of distrust in unsolicited communications they receive and how people behave in response.
Here are 10 takeaways that I found surprising, illuminating or intriguing; perhaps you will have the same reaction.
One-Third of Brits with LandLines Have Filtering Services; Most Mobiles Are Not Protected
34 percent of consumers with landlines said they have a service that screens calls; 26 percent said they use it. Of those who knew their landline is protected by a filtering service, the most popular filtering functionality was the blocking of individual phone numbers that the user had previously input (45 percent) followed by callers being required to leave a recorded message which the recipient listens to before deciding whether to answer (28 percent).
25 percent of smartphone users use functionality on the phone or belonging to an app in order to screen or block calls. A further 9 percent have the means to filter calls on their mobile but do not use it. 50 percent say their mobile is not protected by any filtering capability and 16 percent do not know. Young people are least likely to use the filtering capabilities of their mobile phone. Of those who reported that their mobile offers protection against suspicious calls, 59 percent said they can choose individual numbers to block and 38 percent said they are shown a warning symbol or message when receiving a call that is likely to be fraud or spam.
1 in 10 Ignore Warnings about Incoming Calls; Younger People Are Especially Likely to Ignore Warnings
3 percent of landline users said they would always ignore a message or sound that indicated an incoming call is from a number associated with suspicious calls. A further 8 percent said they would usually ignore the warning and answer the call anyway. The same proportion of mobile users said they always or usually ignore warnings given by their mobile phone.
47.5 percent of landline consumers said they would never answer a call where there was a preceding warning, compared to 40.6 percent who would sometimes answer the call, and 11.8 percent who did not know how they would behave. Mobile users were slightly more likely to respect warnings; 51 percent would never answer a call if they had been given a warning.
People between the age of 16 and 34 were significantly more likely to ignore warnings than any other age group. When using a landline, 6 percent of this age group would always ignore a warning and 24 percent would usually ignore a warning. Only 24 percent said they would never answer a landline call if there was a preceding warning. A similar share of this age group would always or usually ignore warnings on their mobile phone, but a larger proportion (43 percent) would never answer a mobile call following a warning. Young people primarily worried that they may miss an important call if they heeded every warning.
The Public Believes There Is a Significant Likelihood That Warnings Will Be Wrong
50 percent said they had ignored a warning of a potential fraudulent or spam call on a mobile, then found the call they answered was genuine. 30 percent had the same experience but with a landline call.
Young male mobile users were especially likely to report at least one false positive. 78 percent of men between 18 and 34 and 67 percent of women in the same age range reported having a false positive warning with a call received on their mobile.
There Is No Consensus about What Makes an SMS Suspicious
Two example SMS messages were shown to survey respondents so they could rate how likely they were to be genuine.
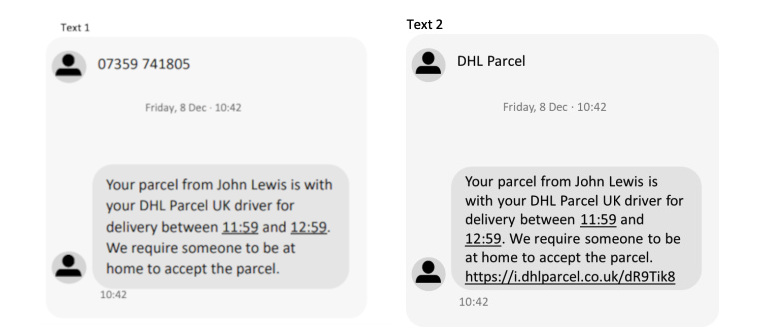
On a scale of 1 to 5, where 1 is definitely not genuine and 5 is definitely genuine, the mean rating for the message on the left was 2.66. 29 percent gave it a score of 1, indicating it was definitely not genuine, compared to 8 percent who gave the opposing score of 5. There were surprising variations in attitudes depending on which part of the UK the respondent was from. The Welsh were most skeptical, with 35 percent giving a score of 1, whilst the Northern Irish were most trusting, with 12 percent giving a score of 5.
The message on the right received very similar scores, with a mean rating of 2.69. There was little consistency in the regional differences between how the two messages were rated, suggesting that these variances are due to sampling errors which would diminish if the same questionnaire was answered by a larger sample of the population.
I consider this question to be flawed because the individual’s perception of whether a message is likely to be genuine could be influenced by incidental details. For example, the ability to tell a genuine from a bogus delivery message may be influenced by how often the respondent has shopped online, and hence if they have experience of receiving genuine messages about deliveries. The perception of authenticity could also be influenced by whether the respondent ever makes purchases from John Lewis, and hence whether they remember the format of messages sent on behalf of that business. Nevertheless, the broad spread of answers across all demographic groups suggests awareness campaigns will never deliver a significant reduction in the number of consumers falling for scam SMS messages because there are such varied opinions about what makes a message appear suspicious.
One of the Key Methods of Identifying a Suspicious Message Will Soon Be Redundant
Respondents were asked about the factors that help them decide if a message is genuine. The top answer was whether the individual was already expecting a message, such as when they order something that needs to be delivered; 73 percent cited this factor. The next most common factor was the spelling or grammar, with 70 percent. Unfortunately, the ability to discriminate based on the quality of language is likely to be undone by easy worldwide access to AI that can reword a scammer’s message for them.
There were notable differences in the factors used by different age groups. Young people were less influenced by whether they expected the message or by the quality of the English in the message. However, the young were more savvy than old people at distinguishing between messages that came from a named company as opposed to one where the originating party is only given as a phone number.
Care Is Needed When Evaluating Consumer Reports about the Frequency of Suspicious Calls and Messages
The likeliest misuse of this survey will involve businesses or journalists cherry-picking alarming statistics about the frequency with which the public is plagued by suspicious communications. Any readers seeking a sensational stat are welcome to stop reading and to turn their attention to the dozen associations and commentators who always seek to hype fraud for cynical reasons. I prefer a more objective assessment of the data, so will set the scene by highlighting what proportion of phone users had not received any suspicious communications during the last three months.
- 44 percent reported receiving no suspicious text messages by SMS, iMessage or RCS chat
- 70 percent reported receiving no suspicious app-based messages
- 61 percent reported receiving no suspicious calls to their mobile phone
- 52 percent reported receiving no suspicious calls to their landline
- 32 percent reported receiving no suspicious messages or calls through any of the channels mentioned above
Obviously this means that over two-thirds of the population has received at least one suspicious communication during the last three months. This is not satisfactory, but we should keep the proportion of people who report there were no suspicious communications in mind when trying to evaluate how many bad calls and messages there are in total, as well as the evenness of the distribution of bad calls and messages over the population. As noted above, people vary greatly in whether they perceive the same message to be suspicious or not, so any estimate of the frequency of fraud or spam communications needs to allow for differences in what is judged to be fraud or spam.
The most common type of suspicious communication was a message sent by SMS, iMessage or RCS. 51 percent said they had received a suspicious text communication through one of these channels during the last three months. Far fewer people reported receiving a suspicious message via their app, at just 19 percent of the population. There was a particularly intriguing overlap between these groups. Of the 378 respondents who said they received a suspicious message by app, 301 were also in the group that reported a suspicious text message by SMS, iMessage or RCS. If the incidence rates for suspicious messages were independent of each other than this overlap would only consist of 193 people. Further research would be needed to determine if this overlap is so large because spammers are using the same contact details to hit consumers through multiple channels, or whether the overlap is skewed by people who over-report the number of suspicious messages they receive relative to the actual number of scams.
The same effect was found when analyzing the overlap between those who said they received a suspicious robocall by mobile or landline. 556 people (27 percent) said they received a suspicious robocall on their mobile during the last three months. 350 people (37 percent) was the equivalent figure for suspicious robocalls to landlines. As the survey found that 92 percent of the owners of landlines also have mobile phones, then 87 people would have received robocalls through both their landline and mobile if the two channels are independent and there is no mis-reporting by people who completed the survey questionnaire. The reported overlap was 136 people. It is possible, but less likely that scammers would have compromised data about both the landline and mobile phone numbers belonging to the same target. This strongly suggests the survey results are being skewed by each individual’s propensity to categorize an incoming call as suspicious.
As a brief aside, this is the kind of simple mathematics that far too few fraud professionals apply to scrutinizing the data they rely upon for decision-making. It takes just a few minutes of effort to identify potential anomalies like these in survey findings. Sadly, people who should know better tend to just repeat whichever statistic suits them, without checking how trustworthy the statistic is.
Older Mobile Users Said They Received Significantly Fewer Suspicious Calls and Messages
33 percent of mobile users between 16 and 34 said they had received a suspicious robocall in the last three months, and 24 percent said they had received a suspicious voice call from a live individual. The proportion of suspicious recorded calls and live calls progressively declined for mobile users in older age ranges, with the over-75’s reporting just 20 percent of them had a suspicious robocall, and 11 percent had a suspicious live call.
The same relationship between age and likelihood of receiving a suspicious communication was also found with messaging. For example, 58 percent of respondents between 16 and 34 said they had received a suspicious text message during the previous three months, compared to just 35 percent of the over-75’s.
However, this trend was not observed when asking the equivalent questions for landline users. 56 percent of landline users over 75 said they had received at least one suspicious recorded or live voice call, equal to the 56 percent of 16 to 24 year olds who had at least one suspicious landline call. The age ranges which reported fewest suspicious calls were 25 to 34, at 37 percent, closely followed by 35 to 44, for whom suspicious voice calls had been received by 38 percent.
Alarming Figures about How Often People Are Spammed That Need to Be Taken With a Pinch of Salt
The 56 percent of survey respondents who said they had received a suspicious message in the last three months were asked how often they had received them. Of this segment, 2 percent (20 people) said they received several suspicious text messages every day, and another 4 percent (44 people) said they received at least one per day. These numbers are startling, even though they relate to only a small fraction of the total population. If true, this would indicate a non-trivial number of scammers and spammers rely on databases of phone numbers that get repeatedly hit, rather than telephoning numbers more randomly. That finding would be somewhat at odds with a honeypot study in the USA which suggested that fraudsters are not applying meaningful methods to select the numbers they call.
To put the most alarming statistics into context, 4 percent of respondents to this question (39 people) were unable to say how often they receive unwanted text messages, despite receiving this question because they had already stated they had received an unwanted message during the previous three months. So there may be some memory bias influencing the results, which indicated about 15 percent of the UK population receives at least one suspicious text message per week.
Equivalent questions about frequency were asked of respondents who had already said they received at least one suspicious voice call in the previous three months. The split for the frequency of suspicious recorded calls was similar to that for suspicious text messages, but these survey statistics end up being the report of very small numbers of people. For example, 13 people out of the original 2202 respondents said they received several suspicious recorded calls each day for the last three months. The unreliability of a statistic like this is highlighted by the comparable figure for suspicious live voice calls. 14 people said they received several suspicious live calls on their mobile every day during the previous three months. Whilst this level of spam is conceivable, it is difficult to understand why an individual would not take one of several steps to alleviate the problem and hence reduce the number of such calls they receive. The groups who said they received multiple suspicious calls each day also reported levels of suspicious text messages and app messages that were much higher than average.
The Temptation to Resort to Speculation When There Is No Information
The survey questionnaire asked every respondent who received a suspicious message or call to speculate about how their phone number might have become known to the party who communicated with them. This shows how even a comprehensive survey can be damaged by bad practice. It is difficult enough to expect people to accurately remember the past. Asking the public to speculate about the methods used by people they know nothing about can only encourage poor decisions based on uninformed guesswork.
People Do Not Know How to Report Suspicious Calls and Messages
It is to the credit of the questionnaire writers that they avoided one mistake that would have further polluted the data they collected. Respondents were asked about reporting suspicious messages to one or other organization. As you might expect, a large slice of the public gave themselves credit for making such reports, to a wide range of entities. Thankfully, it was only after they saw this question that they were then asked if they knew of the 7726 special number for reporting suspicious calls and text messages. Had the order of the questions been inverted, it would have been likely that the results would have been biased by people ‘remembering’ they had used 7726 although they had not known of its existence until reading this question. Because any mis-remembering occurred during the previous question, the chances of respondents then convincing themselves they had used 7726 as a reporting mechanism was minimized.
As a result of choosing this order for asking the questions, we can be confident that the 76 percent of the population who admitted to having never heard about the 7726 reporting number were telling the truth. Another 9 percent answered that they knew there was a special reporting number, but was not aware of it being 7726. 6 percent of all mobile users claim to both know the number and to have used it to report a suspicious text message, whilst 4 percent said they have used it to report a suspicious call.
Conclusions
It would be wonderful to think that experts might use the data from this survey to refine methods of protecting the public from nuisance calls and messages. But I also get the objective data of seeing how many visitors are attracted to each article on Commsrisk, so I already have reasons to believe this article will not be breaking any records for its popularity. For those of you who have read this far and just want some TL;DR findings to influence decision-makers, here are three conclusions worth mulling over.
- There is a widely-held perception that the elderly are especially vulnerable to scams, but the data from this survey suggests that older people are far less likely to engage in risky communications behaviors than the young. The perception of the risk to the old may be skewed because scammers may be making more effort to target older people or because older people are more likely to report the negative communications they receive to an authority. However, older respondents to this survey indicated they were less likely to have received a suspicious call or message than the young.
- It is not enough to simply apply warnings to some calls because very large numbers of people would ignore them. Young people are especially likely to answer their phone anyway. People answer because of the fear of missing out but they also do not consider warnings to be reliable. A significant proportion of respondents claimed to have identified false positives among the warnings they received.
- Telling people to report suspicious calls and messages has some value, but the ability to correctly identify a scam varies considerably. Even if people learn to search for telltale signs like spelling errors, that may just make them more vulnerable to criminals who avoid the same mistakes.
If you are still reading then you may be one of those extraordinary individuals who occasionally checks facts for themselves. You will find this survey’s summary data tables in PDF here, the summary data tables in XLSX here, and the line-by-line breakdown of answers from each of the 2,202 respondents in CSV here. If you do any serious analysis of the latter then please tell me, because I would love to hear what you discover. You will probably also want to see the questionnaire as found here, and the description of the survey objectives and sample design given here.