
I have often argued that measuring the number of customer complaints is a terrible way to measure the scale of the problem that customers are complaining about. It relies upon a lazy and unproven assumption that there is a reliable correlation between the two, even though we know only a fraction of customers ever complain about anything, and that quite a lot of complaints prove to be unjustified when they are investigated. Experience shows that regulators will treat the assumed correlation as an indisputable fact when it suits them (if the number of complaints falls after regulatory action) but may dismiss it completely when it becomes inconvenient (if the number of complaints rises after regulatory action). However, nobody can stop people from using bad logic to selectively exaggerate or downplay the effect they have had on the world, any more than professionals in this industry can make other professionals feel embarrassed about spending millions of dollars on elaborate data-gathering technology only to then rely upon crude opinion polls to tell them if it works. And so we come to the topic of today’s essay: several countries are reporting a significant fall in the number of customer complaints about nuisance calls, but what does this prove?
To quickest way to explain why I wrote this article, even though I expect no behaviors will change as a consequence, involves a simple thought experiment.
- A national regulator implements a plan to deal with a problem that causes lots of complaints. The number of complaints falls over time. What conclusion do you reach?
- Now you learn that two other national regulators implemented radically different plans to address the same kind of problem in their countries. The number of complaints in those countries fell to a similar extent. Now what conclusion do you reach?
Risk managers should be concerned with finding methods that work, and should prefer them to methods that do not work. We try to understand the world by measuring the impact of changes we make, but correlation is not causation. Sometimes the statistics trend in directions that coincide with the action we take. That is why one of the most fundamental tenets of risk management is that professionals should avoid confusing signals with noise. A signal tells you how much a control has influenced the end results. Noise is unexplained variation in the results. It is common to find ourselves in situations where the results have been affected by both signal and noise. Relying upon customer complaints is the epitome of a scenario where it is almost impossible to distinguish between the two. In the specific case of unwanted calls, our interest is in separating the extent to which the number of customer complaints has been affected by intentional action on the part of regulators and telcos, and the extent to which the observed variations remain unexplained. This may be an impossible task, but some skeptical analysis must be applied to prevent statements like the following becoming urban legends:
Critically, the combination of private-led traceback efforts and enforcement, along with other industry and government efforts are proving effective. Consumer complaints regarding illegal and unwanted robocalls continue to decline, a trend that aligns with the deployment of caller ID authentication as well as the ramping up of traceback-powered enforcement.
So wrote Joshua Bercu and Jessica Thompson of the US Industry Traceback Group in a letter to the FCC dated November 13, 2023. Bercu and Thompson have attained the status of experts in robocalls because of the traceback work they oversee. However, the skills required to trace a call are distinct from the skills required to perform statistical analysis, never mind the fact that it is unrealistic to expect an impartial analysis of the data from people who have a vested interest in demonstrating their methods are effective. One of two simple comparisons could cast doubt over the extent to which complaints about unwanted calls are trending downwards because of caller ID authentication and traceback-powered enforcement:
- A similar country shows a similar or greater fall in the number of complaints over the same period, despite not using the highlighted methods.
- The USA exhibited a similar or greater fall in the number of complaints during a period when it was not using the highlighted methods.
It was surprisingly quick and easy to find a counterexample of the first type. The Information Commissioner’s Office (ICO) in the UK has been responsible for collating and publishing the number of complaints about nuisance calls using very similar definitions and across the same time period as the Federal Trade Commission (FTC) does in the USA. The two countries are unusually alike. They speak the same language, they are both advanced economies with a wealthy citizenry, and it is often remarked that the same scams from the same fraudsters target victims in both countries. However, the UK has not emulated the US approach to call authentication nor traceback-empowered enforcement. The latter two stratagems stem from the TRACED Act in the USA, which President Trump signed into law at the end of 2019. STIR/SHAKEN, which Americans refer to as a method of call authentication even though it is not, consequently became mandatory for the biggest US telcos at the end of June 2020. Bercu and Thompson’s Industry Traceback Group received their mandate on July 27, 2020. So if we want to understand the impact of STIR/SHAKEN and traceback on US complaints then it is reasonable to look at trends in complaints about unwanted calls from August 2020 onwards.
The following graph compares complaints received by the FTC about unwanted robocalls with complaints received by ICO about unwanted automated calls for each month from August 2020 to September 2023, indexed so that August 2020 is set to 100 for both datasets.

This graph does not prove that new US controls failed to have any impact, any more than it can be said to prove that new UK controls were solely responsible for the reduction in complaints about robocalls by Brits. But what I find most suggestive about this graph is the very similar proportionate change in complaints over time. Two completely different types of controls might have a similar impact, but I suspect there are other factors which are common to both countries that may be exercising a similar influence on the number of robocalls received by consumers. Such factors might be:
- Telcos implementing simple but effective analytics-based controls to identify and automatically block anomalous and high-usage traffic.
- International carriers tightening policies concerning who they do business with.
- Law enforcement activities in countries where robocalls originate.
Failing to take such factors into account would lead to a lop-sided view where too much credit is given to controls implemented near the call’s termination, and not enough credit is given to controls executed elsewhere. Measuring the impact of controls implemented near the call’s origination, or by major intermediaries will be almost impossible to measure using consumer complaints because such controls will reduce the number of bad calls received in multiple countries.
I focused on robocalls in this example because the US Industry Traceback Group specifically referred to robocalls in their letter, but a similar pattern would have been observed if I had discussed US and UK complaints about nuisance calls where recipients talk to a human being. This also suggests that higher standards adopted by wholesale carriers and tougher law enforcement in foreign countries could be a factor in reducing all kinds of unwanted calls, and especially those which motivate consumers to complain.
The other part of my analysis concerned whether the USA experienced a fall in the number of complaints about robocalls over a different period of time. This fall could not be explained by controls that were only implemented at a later date. It took me no time to find relevant data because Bercu and Thompson included some in their letter, though they did not comment on its true significance. The following graph is copied from their letter without any alteration.
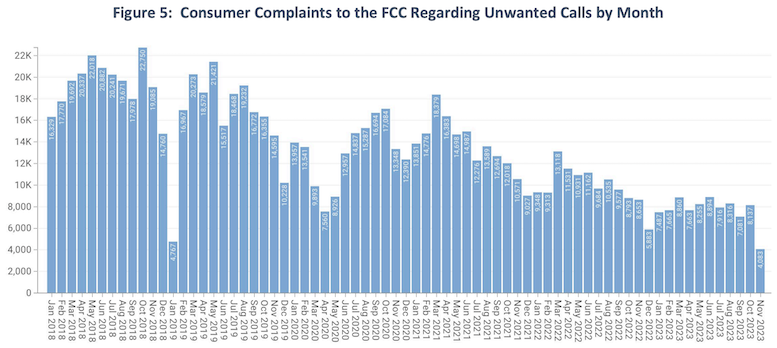
It is understandable that Bercu and Thompson wanted to ingratiate themselves with the FCC by citing the complaints data compiled by the FCC. The FCC data exhibits the same trends as the FTC data, although the FTC data should be preferred because the raw number of complaints received by the FTC is approximately 20 times the number received by the FCC. This means the FTC data is more robust and less likely to be affected by ‘noise’ because far more Americans choose to complain about unwanted calls to the FTC. Putting this to one side, the obvious point to make is that Bercu and Thompson comment on the trend after the TRACED Act was signed and new controls were implemented, although the data they cite clearly shows the number of complaints was falling rapidly before the TRACED Act was passed, then rose immediately after the regulator appointed the Industry Traceback Group and made STIR/SHAKEN mandatory.
Some will argue that falls in the number of complaints that occurred before 2020 were due to major US telcos voluntarily doing things they were later compelled to do. That may be true, but it challenges the theory that complaints have fallen because of a strategy that was only fully defined and realized at a later date. If telcos voluntarily made valuable improvements prior to the imposition of regulatory obligations then telcos and other organizations may still be making important voluntarily contributions to robocall reduction that are not being fully acknowledged. The problem of correctly identifying causes will be especially acute when the cause is located outside of the country receiving the bad traffic, and hence away from the people who are most likely to theorize and comment upon the reasons for falls in bad traffic. Even if controls are working well, we should retain an open mind about all the factors that influence the amount of bad traffic being connected.