Commsrisk’s Global Fraud Dashboard is proving to be very popular, thanks to a growing number of external sites that reference our automatically-updated charts. We aim to delight lovers of accurate information (and to annoy charlatans) by adding new charts each month. Here is a summary of changes to the dashboard since July.
New Graph Shows Huge Rise in German Phone Numbers Disconnected for Sending Spam SMS
Our first graph presenting exclusively German data aggregates daily reports from the Bundesnetzagentur, the German federal government agency responsible for telecoms networks and other utilities. They publish advice about action they take to curb the abuse of specific phone numbers. One of the most common actions is to order the deactivation of a phone number. A standardized explanation is provided for each order, allowing us to discern trends in the kinds of abuses identified in Germany.
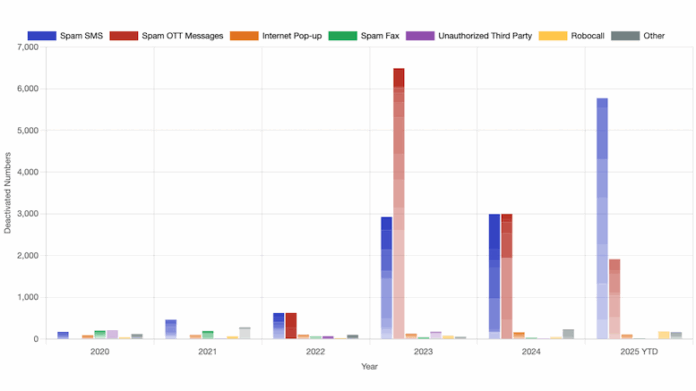
The following snapshot and the live graph shows an enormous surge in deactivation orders for phone numbers that originated spam SMS messages. During 2024 there were 2,995 deactivations for spam SMS, giving an average of 8.2 deactivations for spam SMS per day. The average for 2025 so far is running at treble last year’s rate, with 25.8 deactivations for spam SMS per day. The year end total for spam SMS disconnections will exceed 9,400 if current rates continue. This surge in deactivations for spam SMS also threatens to push the annual total for all deactivations to an all-time high.
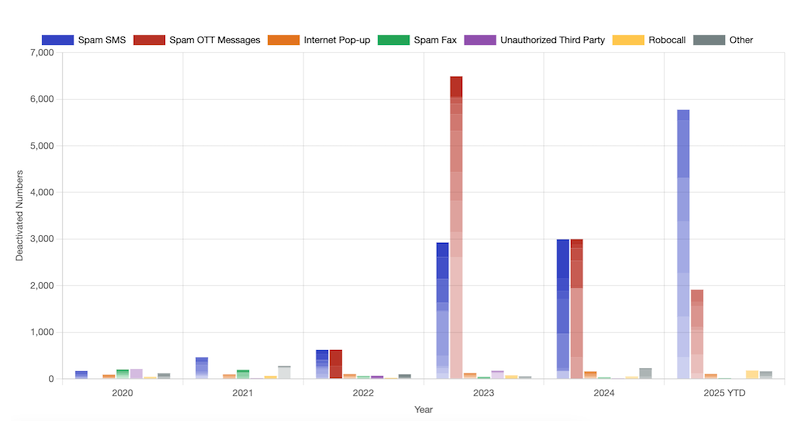
The rising trend in deactivations for spam SMS runs contrary to the falling trend for deactivations for spam messages sent over OTT platforms. The latter peaked at 6,492 deactivations during 2023, then fell to 2,998 during 2024. This year’s running tally is trending slightly higher than the figures for last year, but remains well beneath the peak seen in 2023.
Spam SMS and spam OTT messages are the explanations given for 94.5% of the disconnections ordered by the Bundesnetzagentur in 2025 so far. A variety of different causes are blamed for the remaining 5.5% of disconnected phone numbers, although it is notable that robocalls now feature as the third most frequent reason, at 2.1% of the total for the year to date. There were 148 disconnections for robocalls during June 2025 alone, a higher figure than the sum of all the robocall disconnections between 2022 and 2024. But perhaps the most surprising statistic is that spam fax machines still cause problems in 2025, with the Bundesnetzagentur ordering the disconnection of two phone numbers per month for this reason.
New Rolling Comparison of Complaints about Unwanted Calls in the UK and USA
The number of complaints made by the public about receiving unwanted calls will not be a precise measure of the scale of activity by bad actors, but it does offer one of the easiest ways to compare the results delivered by the contrasting policies of different countries. We have begun the task of constructing country vs. country comparisons by taking the existing data that fed the graphs showing complaints about unwanted calls to the UK Information Commissioner’s Office and complaints about unwanted calls to the US Federal Trade Commission. These have been combined to produce normalized graphs that show monthly complaints in each country per million of the population and the indexed change in the number of complaints relative to January 2020.
One reason we prioritized the construction of these graphs was to counter disinformation about the extent to which complaints data has demonstrated the effectiveness of US policy. This disinformation had led some British professionals to mistakenly believe they were lagging the US in reducing unwanted calls. See this article for a detailed examination of the data and what it says about the effectiveness of policies in both countries, as well as the reliability of information fed to policymakers.
Quarterly Update about Scam Call and SMS Complaints from Australia
The Australian Communications and Media Authority (ACMA) publishes new data about complaints on a quarterly basis, and the figures for April to June 2025 were released a few days ago. They have already been incorporated into the existing rolling graph of complaints about scam Australian comms. I will write a lengthier analysis soon, but the synopsis is that Australia has continued its impressive progress with reducing complaints about scams communicated by voice and SMS.
Fewer Telcos Allowed to Terminate Calls in the USA?
You may have seen the news about the US Federal Communications Commission (FCC) removing 185 firms from its Robocall Mitigation Database (RMD). This effectively prohibits other telcos from carrying voice traffic from these telcos if it is meant to terminate in the USA. 185 may sound like a big number (185 telcos that can no longer spam Americans!) or a small number (less than 2% of the total number of telcos listed in the RMD!) depending on your perspective.
Either way, we know the purge actually happened because it was captured by our weekly graph of additions, deletions and amendments to RMD entries. Stay tuned for a more thorough analysis that discusses the significance of the telcos that were purged (hint: a lot of the deleted entries were old) and what this tells us about the quality of data in the RMD.
Coming Next
One natural extension of the work done so far would involve constructing the graph showing complaints about unwanted calls and SMS messages in Australia, to complement the equivalent graphs for the UK and USA. There are now so few Australians complaining about scam calls and SMS messages (a subset of complaints about all unwanted calls and messages) that it will be instructive to monitor the ratio between scam complaints and all other complaints about unwanted calls. If scam prevention is prioritized then the ratio should change; if the public is poor at distinguishing between scams and (legal) spam then the ratio may remain the same.
We are also exploring the potential to automatically gather statistics about data protection fines for European comms providers. Privacy leaks are a precursor to a lot of criminal activity.
If you know of data sources we should mine, or there are countries which you would like to see added to the dashboard, feel free to share your suggestions.