
Yesterday I discussed serious problems with the sample of telcos that responded to the 2019 Global Fraud Survey of the Communications Fraud Control Association (CFCA) and showed why the telcos who participated were too few in number and too skewed towards rich Western countries to reliably support global conclusions. Today I will provide a breakdown of the report findings, as distributed by CFCA President Jason Lane-Sellers to a professional audience during October’s Subex User Conference. They are covered in the same order as given in the report circulated by the CFCA, and I will seek to identify which are useful, which are unreliable, and which are demonstrably flawed.
Are You a Member of Any Other Organization?
GSM Association (GSMA): 37%, CFCA: 26%, Forum for International Irregular Network Access (FIINA): 14%, European Telecommunications Network Operators' Association (ETNO): 6%, multiple others at 4% or below
The problems with the statistics presented in the CFCA report were apparent from the very first graph, which claimed that 37 percent of survey responses were from GSMA members, 26 percent from CFCA members, 14 percent from FIINA members, and that the remaining 23 percent came from members of 11 other associations. These numbers must all be wrong because the graph totaled to 100 percent even though membership of associations is not mutually exclusive. There will be some telcos who are members of the GSMA and the CFCA and FIINA and many other associations. Whenever a telco belongs to two associations you must double-count that telco in order to obtain the right total for each association, with the consequence that the figures for each separate answer must add up to more than 100 percent in total.
We know that the CFCA is aware of this double-counting issue because their 2017 report (available here and many other places) explicitly states that “many CSPs reported being a member of more than one organization”. This warning was omitted from the equivalent graph in the 2019 report even though the figures are almost the same.
So how and why does the CFCA conspire to jury-rig this graph to total to 100 percent? I suspect that this is far from an innocent mistake, but a deliberate attempt to skew the reporting of the apparent size of various international associations to make the CFCA look relatively large. Whilst the CFCA survey found only 26 percent of respondents were members of their own association, this sounds quite high when compared to 14 percent belonging to FIINA, 4 percent from the Telecommunications UK Fraud Forum (TUFF), just 1 percent from my association, the Risk & Assurance Group (RAG)… and zero percent for the TM Forum!?
Like them or loathe them, the TM Forum boasts more telco members than RAG, TUFF, FIINA and the CFCA put together. AT&T is a member of the TM Forum, and unlike other telcos AT&T also has two representatives on the CFCA Board, so it beggars belief that the CFCA is claiming that not a single telco belonging to the TM Forum made time to respond to this survey.
Meanwhile, consider that almost every telco which belongs to TUFF is also affiliated to RAG. So how could it be possible for TUFF telcos to generate four times as many as responses to this survey as RAG telcos? The only way that is possible is by systematic under-counting of the number of associations that telcos belong to, with a clear order of preference for which associations are counted first, second, third, and so on. This would also explain why FIINA members were noted to be 14 times more likely to respond than RAG members, even though the FIINA Executive Committee kindly shared their entire membership list with RAG earlier this year. Without going into further detail, it is safe to observe that FIINA did not hand over their membership list to RAG because they have 14 times as many active members. It is also clear that the vast majority of FIINA members belong to several of the other associations named in this CFCA survey, begging the question of why they were added to FIINA’s total instead of those of any other group.
In Which Region Are You Located?
Western Europe: 29.1%, North America: 26.6%, Asia: 10.1%, Eastern Europe and Russia: 10.1%, Africa: 8.9%, Central and South America: 6.3%, Middle East: 5.1%, South Pacific: 3.8%
Only 10.1 percent of the CFCA survey responses came from Asia, although more than half of the world lives in Asia. Per yesterday’s analysis of the sample size, this means only six or seven Asian telcos completed the survey. Africa was also badly under-represented.
The CFCA has always had a problem with extending the coverage of their survey beyond their base in the USA, despite repeated attempts to brand their work as ‘global’. What is interesting is that the results are no longer as dominated by US telcos as they were previously, because many more Western European telcos responded to the 2019 survey compared to the previous survey in 2017. Could the increase in survey responses from Western Europe be a direct consequence of the CFCA’s decision to increase the diversity of their leadership team by appointing a Brit, instead of an American, as President?
What Percentage of Your Company’s Revenues are Monitored for Fraud?
Greater than 50%: 50%, 41-50%: 11%, 31-40%: 7%, 21-30%: 9%, 10-20%: 2%, Less than 10%: 20%
50 percent of respondents said they monitored over half of their telco’s revenues for fraud. 20 percent of telcos surveyed said their fraud monitoring did not even cover 10 percent of the company’s revenues. This begs a question: how is this survey supposed to generate a reliable estimate of global telecoms fraud, if half of the respondents know less than half of what is happening in their own business? How are these telcos capable of generating a reliable estimate for the value of the fraud they suffered in their own business, never mind the losses incurred by telcos in other countries?
Where Is Your Fraud Department Situated?
Finance: 36.07%, Security: 27.87%, Operations: 13.11%, Risk Management: 11.48%, IT: 6.56%, Customer Care: 1.64%, Other: 19.67%
Perhaps this is one of the most useful questions in the survey, because even an ill-informed respondent should be able to answer it correctly. However, when listening to Jason Lane-Seller’s explanation of the statistics it became apparent that the figures could be badly misinterpreted. The changes in summary answers from 2017 to 2019 cannot be confidently said to represent changes within existing telcos, because at least a quarter of the respondents to the 2019 survey did not complete the 2017 survey. In other words, this survey does not offer the kind of like-for-like comparison required to conclude that fraud departments moved within telcos, as opposed to observing that different telcos may have made different decisions about where to situate the function. In my experience, telcos do not rearrange their management reporting lines every two years, although CFCA commentators imply that they do.
The most common response to this question was that Fraud is governed by Finance, which was the answer given by 36.1 percent of respondents. In contrast, 46.5 percent of 2017 respondents said their Fraud function reported to Finance. We should also keep in mind that the sample is small: just 61 telcos answered this question in 2019, with 22 saying they had Fraud in Finance, and 17 saying they put it in Security.
This question was most helpful in determining the total number of respondents because the results were given to two decimal places. If just 61 telcos answered other survey questions then there will have been a significant loss of precision when rounding percentages to whole numbers. 1 in 61 is not very close to 1% (i.e. 1 in 100) or 2% (i.e. 1 in 50).
How Long Have You Worked in the Telecom Industry?
3 years or less: 0%, 3-7 years: 10%, 7-10 years: 8%, 10-15 years: 25%, 15-20 years: 21%, 20+ years: 36%
There is no reason to question these numbers, but if the sample is just 61 people then a skew towards older employees probably just reflects the composition of the CFCA’s Board and its network of contacts.
How Long Have You Been Working in Your Fraud Management Organization?
<1 year: 2%, 1-3 years: 15%, 3-7 years: 28%, 7-10 years: 15%, 10-15 years: 15%, 15-20 years: 13%, 20+ years: 13%
The wide spread of results begs the question of whether the survey was always answered by the most senior person working in the telco’s Fraud Department, or whether junior staff sometimes responded on behalf of telcos.
There is one interesting cross-statistic that would have made excellent reading. How long have people been doing fraud management inside the 20 percent of telcos that monitors less than 10 percent of their company’s revenues? Per this answer, some of them have must have spent over three years ‘managing’ fraud for their telco!
What Is the Average Number of People Working in the Fraud Department?
<10,000 Subscribers: 6, 10,001-1,000,000: 9, 1,000,001-10,000,000: 10, 10,000,001-50,000,000: 21, 50,000,001+: 81, Wholesale Only (no end user subscribers): 7
Inferences become less reliable as sample sizes decrease in size. Hence it is impossible to judge if any of these numbers are a worthwhile indicator for the global industry because some of these categories must be based on answers submitted by just two or three telcos. All that we can confidently determine is that department sizes get bigger as telcos get bigger, though there are also reasons to ask why automation is not being used to lower the proportionate size of the anti-fraud teams in telcos with over 50 million subscribers.
How Many False Positives Does Your Fraud Management System Generate?
The answers to this question were so varied – ranging from 2 percent at the low end to 95 percent on the high end – that no meaningful inference can be drawn, and it is not even worth repeating all the numerous but useless data points shared by the CFCA. The only thing we can safely infer is that some people use an FMS that is well tuned to their needs, and some do not!
However, the answers to this question also illustrate that the survey responses must include estimates when it should have been possible for respondents to share precise figures. Each single alarm is either valid or false, and a decent system should at least be able to tell you how many alarms you have, so it should always be possible to calculate the proportion of false positives, and hence use this to drive improvement. However, many of the answers to this question were bunched around suspiciously round numbers. For example, the most common answer to this question was 95 percent, but not a single telco said their rate was 93, 94, 96 or 97 percent. We can reasonably infer there was repeated bunching of answers due to round-number estimates because whilst there was a 93 percent difference between the top and bottom answer, fewer than a quarter of the possible answers that lie between those extremes were chosen by any of the survey respondents.
How Much Time Do You Spend on Average Working False-Positive Cases Each Week?
Less than 1 hour: 10%, 1-2 hours: 19%, 2-3 hours: 15%, 3-4 hours: 15%, 4-5 hours: 12%, 5-10 hours: 8%, More than 10 hours: 21%
This data cannot be used because the question was ambiguously worded. Is it asking for an average for each member of the fraud team, the total number of hours for the whole team, or just the number of hours for the person responding? Different respondents will have given inconsistent answers that cannot be compared to one another because they interpreted the question differently.
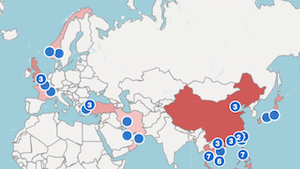
Top 10 Countries that Originate Fraudulent Calls
Before we look at the summary answers shared by the CFCA, let us first review the wording of the question as it appeared in the CFCA’s questionnaire.
From which countries do you see the most fraudulent voice calls originating from (not your customer’s premise equipment) for your organization?
Respondents to this question were then made to rank their top 10 countries. How is it mathematically possible to take multiple rankings from different telcos and then use them to produce a reliable measure of which countries generate most fraud calls? It is easy to devise mathematical scenarios where, for instance, a country that would consistently rank 11th in the hypothetical list of every respondent would generate more fraud calls in total than a country which ranks in first place for half of the respondents but is unranked by all others.
Now let us look at the top 10 reported by the CFCA:
1. Lithuania 5%...
…wait a moment! How did we get from a ranking to a percentage? What mathematical operation was used to perform that feat, and why should it be considered reliable?
2. UK 4%, 3. Latvia 4%, 4. Russia 3%, 5. USA 3%, 6. Spain 3%, 7. Global Mobile Satellite System 3%, 8. Palestine 3%, 9. India 3%, 10. Philippines 2%
Obviously some rounding is occurring here, because otherwise UK and Latvia would be equal second, and there would be 6 regions ranked in equal fourth place. But what is the meaning of the figure being rounded? And if this scoring system is reliable, why destroy precision by reducing the percentages to single figure digits with no decimal places?
My final observation about this question is simple. China is a big country. Asia is a big continent, but it was hardly covered by the survey. I do not believe the fraud patterns experienced by some Asian telcos are likely to be similar to the fraud patterns reported by this survey. So in what sense is this listing of countries informing us about ‘global’ fraud?
Top 10 Countries Where Fraud Terminates
1. Cuba 4% 2. UK 3%, 3. Tunisia 3%, 4. Morocco 3%, 5. Jamaica 3%, 6. Congo 3%, 7. Lithuania 3%, 8. Latvia 2%, 9. Guinea 2%, 10. Seychelles 2%
This question suffers all the same flaws as the previous one. However, the regional bias is even more apparent here. Lots of Cubans live in the United States of America; they do not live in the People’s Republic of China. Fraud does not occur in a theoretical vacuum, but is driven by human desire, including the desire to speak to another person who shares a common language but lives in a foreign country. That is why news stories are dominated by reports of Indians being arrested for facilitating fraudulent calls made to Indian expats in the Middle East, and so forth.
Estimated Global Fraud Loss
USD28.3bn, 1.74% of global revenues
Here is the equation that the CFCA uses to calculate global fraud loss to two decimal places:
Σ((CSP Size x % by Group) x Group Midpoint)/100) x Global Telecom Revenues
Respondents are encouraged to give answers in ranges, such as the range between 1 and 2 percent. That is why the CFCA’s equation has to refer to a ‘midpoint’. So before any numbers are crunched, we can say with certainty that the CFCA’s estimated global fraud loss cannot be accurate to two decimal places. It would have been more honest to also give their answer as a range, but that would mean they would always give the same uninteresting answer after every survey i.e. ‘between 1 and 2 percent’.
To illustrate the seriousness of this flaw, consider what would happen if we surveyed the average height of men by asking 61 adult males if their heights were ‘between 4 feet and 5 feet’, ‘between 5 feet and 6 feet’, or ‘between 6 feet and 7 feet’. The average will lie between 5 feet and 6 feet because the majority of men fall within this grouping. But claiming that men had grown several inches by comparing one sample to another would be nonsense. If the CFCA’s method were used to generate a ‘global’ result of 5 feet and 4 inches that will not be because those figures reflected the actual mean average of the sample; most of the pertinent data was lost when grouping the men into imprecise ranges. Every man in the range ‘between 5 feet and 6 feet’ is treated as if their height is equal to the midpoint of that range i.e. 5 feet and 6 inches. So the number of ‘inches’ presented in the CFCA’s answer would just be a crude indicator of how many of the sampled men belonged to the category of ‘between 4 feet and 5 feet’ relative to the number of men belonging to ‘between 6 feet and 7 feet’.
The CFCA’s global loss estimate is the big statistic that is quoted most often by vendors wanting to make a sale. By now it should be apparent that the data being used to generate this number is incredibly shaky. A limited and skewed sample is being used to extrapolate to a much more diverse planet. A tiny minority of English-speaking managers and analysts – just 61 compared to the thousands of telcos in the world – are determining the rate of fraud for telcos and countries they know nothing about. And according to this survey, 12 of the 61 respondents monitor less than 10 percent of their own telco’s revenues, meaning they would first need to multiply by 10 just to extrapolate to the fraud loss for their own business. After all those serious issues, survey answers like ‘1 to 2 percent’ are being used to generate spuriously precise claims that ‘fraud has risen by 37.1% globally’. Decimal places are being presented in the final figures to disguise how loose the raw data really is.
What I would like to see is a survey that asks fraud managers how much difference they have made. Either fraud managers deliver value, or they do not. Estimating the value being delivered will curb the tendency to conveniently estimate that fraud is a problem that is so serious that more money should be spent on stopping it, but not so serious that anyone deserves to be fired for failing to deliver demonstrable value. In other words, ‘1 to 2 percent’ is the most convenient answer, and only our own complacency leads us to believe this survey is measuring any rises or falls in the actual rate of fraud.
Top Ten Fraud Methods
I could give you the top ten kinds of fraud listed in the survey, but what is the point? By now you either agree that the flaws in this survey are so painfully apparent that analysis has become worthless, or you want to believe the CFCA’s figures are reliable because they suit your prejudices. Breaking out the detail of different fraud methods from just 61 responses means giving undue credence to groups of answers that may only be supported by five or six telcos, whilst also knowing the value ascribed to each method has been reverse-engineered to aggregate to a total that is incorrect because it was calculated using the formula shown above.
Consider also that account takeover fraud and wangiri fraud were listed amongst the fraud methods, and that they are primarily used to steal money from customers, not telcos. Somehow these losses have been lumped in with all the others – invalidating the description of the previous statistic which claimed to present fraud as a percentage of the telco’s revenues. If customers are losing USD3bn each year to account takeover and wangiri frauds, then that is not the same as saying telcos are losing 0.2 percent of their revenues to account takeover and wangiri fraud! The figures presented by the CFCA completely fail to distinguish between the different victims of each type of fraud, wrongly making them all seem like they have the same impact on the telco’s reported performance.
Footnotes
The report distributed by Jason Lane-Sellers at the Subex User Conference had the CFCA logo on the covering page and was entitled “2019 Global Fraud Loss Survey & Digital Identity Cybercrime Report”. The addition of digital identity cybercrime is a new development, because none of the CFCA’s previous surveys attempted to cover that topic. Nor did this year’s questionnaire. This latter research on digital identities was performed separately by LexisNexis, the employer of CFCA President Jason Lane-Sellers, and was tacked on to the end of the CFCA’s survey findings to make them seem part of the same body of work.
A short while ago I enjoyed a vigorous debate with Peter Coulter of AT&T and FIINA, and he insisted that the CFCA’s survey would be ruined if it was sponsored by a supplier. Apparently that is not the view of the CFCA President, who is advertising his employer via the survey. As I know literally nothing about the quality of the research performed by LexisNexis I will decline to comment on their findings.
Why Not Help the CFCA to Improve their Questionnaire?
One reason I know about the CFCA’s questionnaire is that they send me the questions before they are circulated to telcos in order to solicit my advice. They do this because the CFCA wants me to help them gain a better understanding of fraud in African telcos. Just imagine the ridiculous scene: a white American asks a white European about what is happening in African fraud! That they would risk ridicule by asking for my insights into the African market just shows how few friends the CFCA has outside of Western countries. Previously I said nothing about this, but the lack of progress in tackling the apparent racism in telecoms risk management leads me to believe it is now necessary to speak up about white professionals in Western countries who are seemingly unable to engage with non-white professionals in Africa and Asia.
Probably the CFCA will never ask me for advice again. Fuck ’em. They have the cheek to ask me for help in advance of surveys, but never have the decency to share the raw results with me afterwards. After thinking more carefully about these figures, which feature so many peculiar and inconsistent ways of rounding and summarizing the results, I now understand why they would prefer to hide the raw data from me.
Should Anyone Quote the CFCA Findings?
Nobody in their right mind would conclude that a survey which is so flimsy is generating reliable figures. On the contrary, there is good reason to believe that half of the small sample of telcos who completed this survey would be unable to accurately estimate fraud losses within their own business. But that will not stop marketing dorks from repeating these numbers ad nauseam. Anyone who does should then ask themselves a much simpler question: if they repeat these figures because they suit their prejudices and objectives, why even bother waiting two years for the next survey to come out? We might as well just make up numbers, so long as they always fall between 1 and 2 percent of revenues.
When all things are considered, fraud managers most often complain that executives do not believe in the business case for investing in fraud management, despite all the evidence presented to them. If the CFCA’s findings are used to support a business case, then the executives are right to reject it.