October 2026




Fake base stations may send scam and spam SMS messages to mobile phones within range of their radio signal; they are often referred to as SMS blasters if programmed to send high volumes of the same message repeatedly. They may also be referred to as IMSI-catchers although the overriding purpose is transmitting messages rather than gathering data. They allow scammers to bypass controls on messages imposed by genuine mobile network operators and upstream telcos. They are usually transported around densely populated areas to mitigate their limited range. Victims will report an interruption of their usual network connection followed by a downgrade to a 2G connection; the downgrade circumvents security measures inherent to 3G and above.
Scam messages sent using SMS blasters typically impersonate reputable organizations and include hyperlinks to phishing websites. Suppliers of SMS blasters may describe them as an advertising tool to make their use appear legal. However, they should still be prohibited because they interrupt the phone user's connection to real networks, leaving them uncontactable and unable to call emergency services.
The map shows where fake base stations have been used to send SMS messages. The darkness of the shading indicates the scale of use reported in that country. Zoom in and click on the dots to read the details of reported incidents. Use the timeline to select a date range, then press play to see reported incidents appear month by month.
Source: Commsrisk weekly AI automated web search
Last updated 15 October 2026

Fraudulent and other potentially harmful SMS messages may be blocked automatically by network firewalls and other kinds of filtering technology. Some countries mandate the use of blocking technologies to reduce the number of bad SMS messages received by consumers. In other countries, telcos may voluntarily choose to block SMS messages. This map summarizes information in the public domain about the extent of SMS blocking in various countries.
The map is based upon data supplied by national authorities where available, or upon the data published on behalf of major telcos if no national data is available. No data has yet been found in the public domain for countries shown in white.
A blocking score is calculated for each country where figures have been published for the number of SMS messages blocked. The score represents the number of SMS messages blocked per day per million inhabitants, according to the most recent data available. Deeper shades of green reflect higher blocking scores.
If there is no national data but individual telcos have published their own figures then we calculate a national score by aggregating the number of SMS messages blocked per those telcos which reported a blocking statistic. If a telco has not reported any SMS blocking statistics then it is assumed they executed zero blocks for the purposes of calculating an aggregate national total.
Some national authorities and some telcos report that SMS blocking occurs but have not published any statistics. Countries are shown in yellow where there is SMS blocking but no statistics are available.
Source: Commsrisk weekly AI automated web search
Last updated 14 October 2026

This chart shows the number of GDPR fines issued to media, telecoms and broadcasting companies, by calendar year, since the introduction of GDPR. The five countries that have issued the most fines are shown separately, with the remaining countries grouped as 'other'. Figures for the current year are correct at the date of the last update.
Not all countries which follow GDPR have chosen to make fines public; some keep the value of fines secret.
Source: CMS.Law GDPR Enforcement Tracker
Last updated 14 October 2026
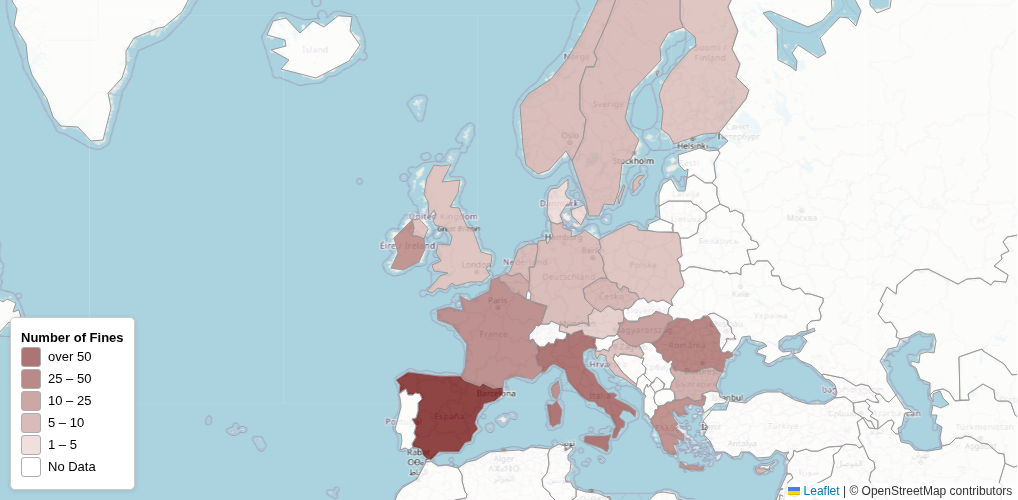
This map shows the number of GDPR fines issued to media, telecoms and broadcasting companies by each country.
Not all countries which follow GDPR have chosen to make fines public; some keep the value of fines secret.
Source: CMS.Law GDPR Enforcement Tracker
Last updated 13 February 2026

This chart shows the total nominal value, in Euros, of GDPR fines issued to media, telecoms and broadcasting companies, by calendar year, since the introduction of GDPR. The five countries that have issued the largest aggregate value of such fines are shown separately, with the remaining countries grouped as 'other'. Totals for the current year are correct at the date of the last update.
Not all countries which follow GDPR have chosen to make fines public; some keep the value of fines secret.
Source: CMS.Law GDPR Enforcement Tracker
Last updated 14 October 2026
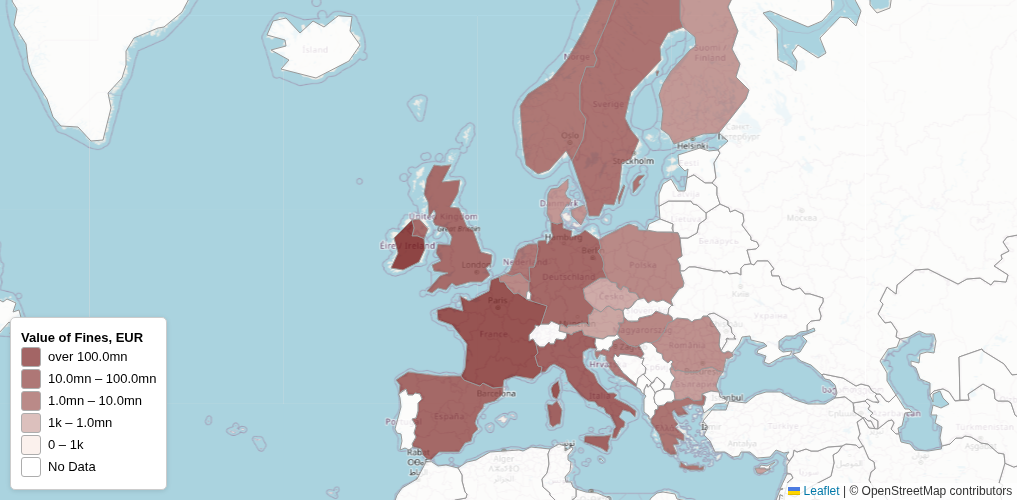
This map shows the total nominal value, in Euros, of GDPR fines issued to media, telecoms and broadcasting companies by each country.
Not all countries which follow GDPR have chosen to make fines public; some keep the value of fines secret.
Source: CMS.Law GDPR Enforcement Tracker
Last updated 13 February 2026

This chart shows the 20 largest known GDPR fines received by media, telecoms or broadcasting businesses since the introduction of GDPR. The labels show the country that issued the fine, the company that received it, and the year it was issued. Hover over a bar to see the full name of the company and the exact value of the fine.
Not all countries which follow GDPR have chosen to make fines public; some keep the value of fines secret.
Source: CMS.Law GDPR Enforcement Tracker
Last updated 1 October 2026

This chart shows the average nominal value of GDPR fines issued to media, telecoms or broadcasting businesses per each country.
Not all countries which follow GDPR have chosen to make fines public; some keep the value of fines secret.
Source: CMS.Law GDPR Enforcement Tracker
Last updated 14 October 2026

The Australian Communications and Media Authority (ACMA) reports the number of complaints it receives from Australians about scam calls and messages. Quarterly updates to these statistics have been provided since the quarter covering July to September 2023; only annual figures were provided before then. The ACMA summarizes figures per its financial year, which runs from July to June.
Source: Australian Communications and Media Authority
Last updated 16 April 2026

This chart shows nominal monthly scam losses reported to Scamwatch by the Australian public where the scam was initiated by either a phone call or a text message.
Source: Australia Scamwatch
Last updated 6 March 2026

This chart compares the quarterly number of complaints reported to ACMA about scam calls and text messages with the nominal value of scam losses reported to Scamwatch where the scam was initiated by a call or text message.
Sources: Australian Communications and Media Authority and Australia Scamwatch
Last updated 16 April 2026

This chart compares the quarterly number of complaints reported to ACMA about scam calls with the nominal value of scam losses reported to Scamwatch where the scam was initiated by a phone call.
Sources: Australian Communications and Media Authority and Australia Scamwatch
Last updated 16 April 2026

This chart compares the quarterly number of complaints reported to ACMA about scam text messages with the nominal value of scam losses reported to Scamwatch, where the scam was initiated by a text message.
Sources: Australian Communications and Media Authority and Australia Scamwatch
Last updated 16 April 2026

The Australian Communications and Media Authority (ACMA) reports the number of complaints it receives from Australians about unwanted calls, SMS messages and commercial instant messages on a quarterly basis. The ACMA summarizes figures per its financial year, which runs from July to June.
Source: Australian Communications and Media Authority
Last updated 16 September 2026

Trends in the ratio of complaints about scam and unwanted communications can be derived from the complaints data of the Australian Communications and Media Authority (ACMA) (see above). This graph shows the number of complaints about scams has declined much more rapidly than the number of complaints about unwanted traffic since the ACMA's financial year 2020-21.
The data indicates that the sharp decline in the number of complaints about scams cannot be dismissed as due to consumers becoming fatigued about complaining. A policy that successfully targets reductions in illegal traffic will likely result in a widening gap with the number of complaints about traffic that is unwanted by consumers but which cannot be systematically reduced by regulatory intervention because the traffic is legal.
Source: Australian Communications and Media Authority
Last updated 3 January 2026

The Australian Communications and Media Authority (ACMA) records complaints from the Australian public about scam and spam calls and text messages. This graph shows the absolute number of complaints in each category for each ACMA financial year since 2020-21. The ACMA's financial year end is at the end of June.
The data shows that complaints have fallen across the board. There are many more complaints about unwanted communications than scam communications, and complaints about scams have fallen by a larger proportionate degree than complaints about unwanted communications.
Source: Australian Communications and Media Authority
Last updated 3 January 2026

The Canadian Anti-Fraud Centre records the initial contact method given in reports submitted by the public. This chart covers Canadian reports that identify a call or text message as the initial contact method.
Source: Canadian Anti-Fraud Centre
Last updated 6 August 2026

This graph shows losses reported to the Canadian Anti-Fraud Centre where a call or text message was identified as the initial contact method. The figures are amounts reported by members of the public.
Source: Canadian Anti-Fraud Centre
Last updated 6 August 2026

These figures count complaints submitted to the Canadian Anti-Fraud Centre that identify a direct call as the solicitation method. CAFC records these submissions as reports; they may be submitted by victims or witnesses and may describe attempted fraud where no money was lost. They are fraud complaints, not general unwanted-call complaints or adjudicated counts of crimes. The loss series sums the amounts reported in those records.
Source: Canadian Anti-Fraud Centre
Last updated 6 August 2026

These figures count complaints submitted to the Canadian Anti-Fraud Centre that identify a text message as the solicitation method. CAFC records these submissions as reports; they may be submitted by victims or witnesses and may describe attempted fraud where no money was lost. They are fraud complaints, not general unwanted-text complaints or adjudicated counts of crimes. The loss series sums the amounts reported in those records.
Source: Canadian Anti-Fraud Centre
Last updated 6 August 2026

Finland’s protected SMS Sender ID register lists names reserved for messages sent by the organisations that registered them.
The bars show new registrations each month and the line shows the cumulative number registered.
Source: Finnish Transport and Communications Agency
Last updated 16 October 2026

Germany's Bundesnetzagentur (Federal Network Agency) is a regulatory agency with responsibility for electronic communications and other networked services. It has the power to take action when phone numbers are abused, including deactivating those numbers. Bundesnetzagentur provides a daily update of all actions taken against each specific phone number.
This graph summarizes how many phone numbers have been deactivated since the beginning of 2020 per each of the most common reasons noted by the Bundesnetzagentur. Differences in shading are used to indicate the number of deactivations ordered during each month of the year, with January being the lightest shade and December being the darkest. The actual date of deactivation will typically be 4-6 days after the deactivation order. Mouseover a column to see exact totals for each month.
Common reasons to deactivate a phone number include: sending spam SMS; sending spam direct messages on OTT platforms (e.g. WhatsApp); callback numbers displayed in computer pop-ups; unauthorized use by third parties; and originating robocalls.
Source: German Bundesnetzagentur
Last updated 9 October 2026

Germany's Bundesnetzagentur (Federal Network Agency) is a regulatory agency with responsibility for electronic communications and other networked services. It has the power to take action when phone numbers are abused, including deactivating those numbers. Bundesnetzagentur provides a daily update of all actions taken against each specific phone number.
This graph shows how many phone numbers were subject to temporary payment suspensions since the beginning of 2020. Payment suspensions are a control which stops criminals benefiting from the practice of generating traffic to a phone number in the expectation that they will receive a share of the payments for traffic terminating at that number. Such payments can be an incentive for the artificial inflation of traffic and for the stimulation of traffic that would normally be paid for by the victim of a hacked system or deceptions that provoke phone users to make outbound calls. Differences in shading are used to indicate the number of deactivations ordered during each month of the year, with January being the lightest shade and December being the darkest. Mouseover a column to see exact totals for each month.
Source: German Bundesnetzagentur
Last updated 1 August 2026

WhatsApp has become an increasingly important vector for scam communications. This graph shows the number of accounts associated with Indian phone numbers that WhatsApp has banned because of suspected or proven abuses of their policies.
Source: WhatsApp
Last updated 2 October 2026

Indian communication providers receive complaints about unwanted commercial calls and SMS sent without the recipient’s consent or contrary to their registered preferences. The chart shows complaints involving registered telemarketers and senders as application-to-person (A2P), and those involving unregistered telemarketers as person-to-person (P2P). These are complaint counts, not the number of communications sent or confirmed breaches. The earlier bars show yearly totals. From 2025, each bar is divided into monthly totals.
Source: Telecom Regulatory Authority of India
Last updated 6 August 2026

Irish regulator ComReg publishes information notices that include statistics on the total number of calls that were automatically blocked for suspected scam activity. This graph summarizes data from relevant information notices.
Source: Irish Commission for Communications Regulation
Last updated 23 April 2026

Irish regulator ComReg publishes information notices that include statistics on the total number of calls that were automatically blocked for suspected scam activity. This data includes an analysis of the monthly totals broken down by calls with spoofed fixed-line CLIs, calls with spoofed mobile CLIs, and calls which presented CLIs that match entries on the national Do Not Originate (DNO) or Protect Numbers (PN) lists.
Source: Irish Commission for Communications Regulation
Last updated 22 December 2025

The Commission for Communications Regulation (ComReg) is the Irish regulator of communications services. Following the introduction of their mandatory SMS Sender ID registry in early July 2025, they have reported on the proportion of A2P SMS messages that Irish phone users receive with a 'Likely Scam' warning. These warnings indicate that the originator of the SMS message has failed to register their Sender ID. ComReg has also reported the number of registered Sender IDs.
Source: Irish Commission for Communications Regulation
Last updated 23 April 2026

The National Police Agency of Japan reports how many phone numbers were linked each month to fraud schemes carried out remotely by telephone or online messaging. The figures include numbers identified through attempted scams and information reported by the public. A number is counted once within a month but may be counted again in later months.
Source: Japan National Police Agency
Last updated 5 August 2026

Japan’s National Police Agency reports fixed and 050 IP phone numbers suspended after being linked to fraud, alongside mobile numbers identified and referred to operators for possible suspension.
Source: Japan National Police Agency
Last updated 4 August 2026

The National Police Agency of Japan counts calls known to police in which the caller probes for details such as the recipient’s name, address, assets or financial institutions used. The agency treats these calls as warning signs of fraud schemes in which victims are contacted remotely and deceived into transferring money or other assets.
Source: Japan National Police Agency
Last updated 4 August 2026

The National Police Agency of Japan refers LINE and Meta accounts linked to remote fraud schemes to the platforms for review. The graph shows the number of accounts referred.
Source: Japan National Police Agency
Last updated 5 August 2026

The National Police Agency of Japan records the communication service used when the fraud was carried out, separately from the service used for the initial contact. This chart shows the share of social media investment and romance scam cases in which that service was LINE.
Source: Japan National Police Agency
Last updated 4 August 2026

The New Zealand Department of Internal Affairs receives reports of suspicious SMS through the 7726 service. The Department attributes the sharp increase from 2021 mainly to FluBot, an Android malware campaign spread through SMS links. The graph shows annual totals for 2020 to 2022. From 2023, each annual bar is divided into monthly totals.
One-click reporting launched in December 2024. An error during the launch generated unnecessary automated responses from the 7726 service and increased the number of reports submitted that month. The highlighted month marks this change in reporting behaviour.
Source: New Zealand Department of Internal Affairs
Last updated 29 September 2026

CERT Polska is Poland’s national computer security incident response team within NASK – National Research Institute. The graph shows the total number of suspicious SMS messages it received and the number it classified as fraudulent.
Source: CERT Polska
Last updated 15 October 2026

Poland's Do Not Originate register lists telephone numbers used exclusively to receive calls. Operators block calls that present a listed number as the caller ID. A separate register lists SMS integrators approved to send messages for public bodies.
The graph shows the number of active entries in each register at the end of each month.
Source: Polish Office of Electronic Communications
Last updated 17 October 2026

The Singapore Police report how many of the scam cases they deal with each year began with a voice call to the victim.
Source: Singapore Police Force
Last updated 25 March 2026

The Singapore Police report how many of the scam cases they deal with each year began with a text message to the victim.
Source: Singapore Police Force
Last updated 25 March 2026

The Singapore Police report how many of the scam cases they deal with each year began with a voice call or a text message to the victim. Both have begun trending downwards.
Source: Singapore Police Force
Last updated 25 March 2026

The Singapore Police report how many of the scam cases they deal with each year began with social media, contact through a messaging platform, a voice call or a text message to the victim. Examples of social media include Facebook, TikTok and Instagram. Examples of messaging platforms include WhatsApp, Telegram and Facebook Messenger. All have begun trending downwards. There are considerably more scams circulated using over-the-top services than through traditional phone services.
Source: Singapore Police Force
Last updated 25 March 2026

The Singapore Police report how many of the scam cases they deal with each year began with the scammer contacting the victim through WhatsApp.
Source: Singapore Police Force
Last updated 25 March 2026

The Singapore Police report how many of the scam cases they deal with each year began with the scammer contacting the victim through WhatsApp, a phone call or an SMS message.
Source: Singapore Police Force
Last updated 25 March 2026

Fake friend call scams have featured among the Singapore Police's 10 most common types of scam since 2021. These scams involve a phone call or WhatsApp call from a scammer pretending to be a friend or relative of the target, who is then asked to transfer money to a bank account. There is a strong correlation between the number of cases and the monetary value lost because there is limited variance in the amount that scammers will request for the transfer from the victim.
Values are shown in SGD.
Source: Singapore Police Force
Last updated 25 March 2026

The usual reason for the Singapore Police Force requiring a phone line to be removed from service is because it is being used for scams. The police do not report the exact number they disrupt, but instead report a minimum which may be below the actual number taken out of service due to their intervention.
Source: Singapore Police Force
Last updated 25 March 2026

The usual reason for the Singapore Police Force requiring a WhatsApp account to be removed from service is because it is being used for scams. The police do not report the exact number they disrupt, but instead report a minimum which may be below the actual number taken out of service due to their intervention.
Source: Singapore Police Force
Last updated 25 March 2026

The usual reason for the Singapore Police Force requiring a phone line or WhatsApp account to be removed from service is because it is being used for scams. The police do not report the exact number they disrupt, but instead report a minimum which may be below the actual number taken out of service due to their intervention.
Source: Singapore Police Force
Last updated 25 March 2026

The Korea Internet & Security Agency estimates the monthly number of spam voice calls received per person using a seven-day survey of 1,500 mobile users conducted twice a year.
Source: Korea Internet & Security Agency
Last updated 11 July 2026

The Korea Internet & Security Agency estimates the monthly number of spam messages received per person using a seven-day survey of 1,500 mobile users conducted twice a year.
Source: Korea Internet & Security Agency
Last updated 11 July 2026

The Korea Internet & Security Agency (KISA) estimates monthly spam SMS and voice calls received per person from a seven-day survey of 1,500 mobile users conducted twice a year.
Source: Korea Internet & Security Agency
Last updated 11 July 2026

These six-month totals combine spam voice calls reported by users with commercial advertising detected by the Korea Internet & Security Agency (KISA) mobile honeypot. The honeypot uses approximately 18,000 virtual mobile numbers that have never been assigned to subscribers. Because nobody could have consented to receive advertising on those numbers, the agency classifies any commercial advertising they receive as spam. User reports may also include lawful advertising or non-commercial calls.
Source: Korea Internet & Security Agency
Last updated 11 July 2026

These six-month totals combine spam SMS reported by users with commercial advertising detected by the Korea Internet & Security Agency (KISA) mobile honeypot. The honeypot uses approximately 18,000 virtual mobile numbers that have never been assigned to subscribers. Because nobody could have consented to receive advertising on those numbers, the agency classifies any commercial advertising they receive as spam. User reports may also include lawful advertising or non-commercial messages.
Samsung changed its handset spam-reporting interface in February 2023, making reports easier to submit and increasing participation. The annotation marks the resulting break in reporting behavior.
Source: Korea Internet & Security Agency
Last updated 11 July 2026

These six-month totals combine spam SMS and voice calls reported by users with commercial advertising detected by the Korea Internet & Security Agency (KISA) mobile honeypot. The honeypot uses approximately 18,000 virtual mobile numbers that have never been assigned to subscribers. Because nobody could have consented to receive advertising on those numbers, the agency classifies any commercial advertising they receive as spam. User reports may also include lawful advertising or non-commercial content.
Samsung changed its handset spam-reporting interface in February 2023, making reports easier to submit and increasing participation. The resulting break affects the SMS series.
Source: Korea Internet & Security Agency
Last updated 11 July 2026

The Korea Internet & Security Agency (KISA) estimates monthly spam voice calls received per person from a seven-day survey of 1,500 mobile users. Each provider line shows the average reported by participating customers of SKT, KT or LG U+.
Source: Korea Internet & Security Agency
Last updated 11 July 2026

The Korea Internet & Security Agency (KISA) estimates monthly spam SMS received per person from a seven-day survey of 1,500 mobile users. Each provider line shows the average reported by participating customers of SKT, KT or LG U+.
Source: Korea Internet & Security Agency
Last updated 11 July 2026

These shares classify spam SMS from user reports and the Korea Internet & Security Agency (KISA) mobile honeypot as domestic or foreign in origin. The honeypot uses approximately 18,000 virtual mobile numbers that have never been assigned to subscribers. Because nobody could have consented to receive advertising on those numbers, the agency classifies any commercial advertising they receive as spam.
The percentages are based on messages KISA classifies as spam and can link to an identifiable sending provider.
Source: Korea Internet & Security Agency
Last updated 11 July 2026

These shares classify spam SMS from user reports and the Korea Internet & Security Agency (KISA) mobile honeypot by sending route. The honeypot uses approximately 18,000 virtual mobile numbers that have never been assigned to subscribers. Because nobody could have consented to receive advertising on those numbers, the agency classifies any commercial advertising they receive as spam. Web or bulk SMS services and mobile SMS are domestic routes; Other domestic includes fixed-line and internet-telephone services.
The percentages are based on messages KISA classifies as spam and can link to an identifiable sending provider.
Source: Korea Internet & Security Agency
Last updated 11 July 2026

The Korea Internet & Security Agency (KISA) estimates monthly spam SMS received per person from a seven-day survey of 1,500 mobile users. Finance includes investment promotions. Other contains the remaining categories.
Source: Korea Internet & Security Agency
Last updated 11 July 2026

The Korea Internet & Security Agency (KISA) estimates monthly spam voice calls received per person from a seven-day survey of 1,500 mobile users.
Source: Korea Internet & Security Agency
Last updated 11 July 2026

These shares combine user reports with detections from the Korea Internet & Security Agency (KISA) mobile honeypot, which uses approximately 18,000 virtual mobile numbers that have never been assigned to subscribers. Because nobody could have consented to receive advertising on those numbers, the agency classifies any commercial advertising they receive as spam. User reports may also include lawful advertising or non-commercial messages.
Source: Korea Internet & Security Agency
Last updated 11 July 2026

These shares combine user reports with detections from the Korea Internet & Security Agency (KISA) mobile honeypot, which uses approximately 18,000 virtual mobile numbers that have never been assigned to subscribers. Because nobody could have consented to receive advertising on those numbers, the agency classifies any commercial advertising they receive as spam. User reports may also include lawful advertising or non-commercial calls.
The categories describe the apparent purpose of the call. Voice-phishing lures are impersonation calls intended to prompt the recipient to visit a website or call another number.
Source: Korea Internet & Security Agency
Last updated 11 July 2026

The chart tracks cases that Taiwan’s National Police Agency records as telecommunications fraud. The data does not distinguish between calls, SMS or other telecommunications channels.
Source: Taiwan National Police Agency
Last updated 7 August 2026

The Information Commissioner's Office (ICO) reports the number of complaints it receives from Brits about unwanted calls. Complaints are categorized according to whether the recipient was played a message by a machine or was spoken to by a live human being.
Source: UK Information Commissioner's Office
Last updated 10 September 2026

The Information Commissioner's Office (ICO) reports the number of complaints it receives from Brits about unwanted SMS messages.
Source: UK Information Commissioner's Office
Last updated 10 September 2026

The Office of Communications (Ofcom) is the UK regulator of communications services. Ofcom commissions surveys of the public for various reasons, including the public perception about scam and nuisance phone activity. This chart reproduces the results from a 2026 survey about the proportion of Brits who reported that they received at least one suspected scam call or text message during the three months before they were surveyed.
Source: UK Office of Communications

The Federal Trade Commission (FTC) reports the number of complaints it receives from Americans about unwanted calls. Complaints are meant to be categorized according to whether the recipient was played a message by a machine or was spoken to by a live human being. However, flaws in the collection of complaints data means the distinction between live and automated calls is not captured for a non-trivial portion of complaints reported to the FTC.
The reported figures for October and November 2025 should be ignored. They are unrepresentative because the shutdown of the US government that occurred between 1 October and 12 November interfered with the collection of data by government agencies.
Source: US Federal Trade Commission
Last updated 1 October 2026

This graph shows complaints submitted to the Federal Communications Commission and classified as a voice call or text message. Records without a call or message classification are excluded.
The reported figures for October and November 2025 should be ignored. They are unrepresentative because the shutdown of the US government that occurred between 1 October and 12 November interfered with the collection of data by government agencies. The affected period is highlighted on the chart.
Source: US Federal Communications Commission
Last updated 20 October 2026

This chart is indexed to January 2020 to show the relative change in unwanted-call complaints received by each agency since then. All figures have been normalized so that the equivalent statistic for January 2020 would be equal to 100.
The Federal Communications Commission and Federal Trade Commission operate separate complaint systems with different definitions and reporting routes.
The FCC series includes records explicitly classified as voice calls. The FTC series combines live, automated and uncategorized Do Not Call complaints. The reported figures for October and November 2025 should be ignored. They are unrepresentative because the shutdown of the US government that occurred between 1 October and 12 November interfered with the collection of data by government agencies. The affected period is highlighted on the chart.
Sources: US Federal Communications Commission and US Federal Trade Commission
Last updated 20 October 2026

This chart shows, by calendar year, how many fines the FCC proposed and how many fines it issued, per the powers in the TRACED Act.
Counts are taken from the FCC's annual TRACED Act reports to Congress and attributed to the year when the enforcement action occurred.
The FCC publishes its annual report to Congress each December. The most recent report was issued in December of the year following the reporting period, almost twelve months after the year in question ended.
Source: US Federal Communications Commission TRACED Act annual reports to Congress
Last updated 9 March 2026

This chart shows, by calendar year, the total nominal value in US dollars of fines per the powers in the TRACED Act that the FCC proposed, the value of fines confirmed in forfeiture orders, and the value of fines and criminal penalties that were actually collected.
Values are taken from the FCC's annual TRACED Act reports to Congress and attributed to the year when the underlying violations or collections occurred.
The FCC publishes its annual report to Congress each December. The most recent report was issued in December of the year following the reporting period, almost twelve months after the year in question ended.
Source: US Federal Communications Commission annual reports to Congress
Last updated 9 March 2026

This chart shows, by calendar year, the cumulative value of fines, per the powers in the TRACED Act, that the FCC has issued, alongside the cumulative value of fines and criminal penalties actually collected.
Values are taken from the FCC's annual reports to Congress and attributed to the year when the underlying violations or collections occurred.
The FCC publishes its annual report to Congress each December. The most recent report was issued in December of the year following the reporting period, almost twelve months after the year in question ended.
Source: US Federal Communications Commission annual reports to Congress
Last updated 9 March 2026

The Internet Crime Complaint Center (IC3) of the Federal Bureau of Investigation (FBI) collates reports of crimes with a cyber or telecoms dimension, including the hijacking of a customer's phone account through an unauthorized SIM swap. A significant portion of these SIM swaps are stepping stones towards raiding a victim's cryptocurrency wallet.
Police statistics for crimes involving technology can be adversely impacted by a high degree of subjectivity in how these crimes are classified and by double-counting of a crime that has been reported to the police by multiple independent sources. This can sometimes lead to the revision of previously issued figures. IC3 appends several caveats to this effect when issuing its statistics.
Source: The US Federal Bureau of Investigation Internet Crime Complaint Center
Last updated 17 April 2026

The Internet Crime Complaint Center (IC3) of the Federal Bureau of Investigation (FBI) collates reports of crimes with a cyber or telecoms dimension, including the hijacking of a customer's phone account through an unauthorized SIM swap. A significant portion of these SIM swaps are stepping stones towards raiding a victim's cryptocurrency wallet.
Police statistics for crimes involving technology can be adversely impacted by a high degree of subjectivity in how these crimes are classified and by double-counting of a crime that has been reported to the police by multiple independent sources. This can sometimes lead to the revision of previously issued figures. IC3 appends several caveats to this effect when issuing its statistics.
The subjectivity nature of crime classification is the likeliest explanation for IC3 reporting a higher total value for SIM swap crimes involving cryptocurrency than the total value of all SIM swap crimes during 2024.
Source: The US Federal Bureau of Investigation Internet Crime Complaint Center
Last updated 17 April 2026

The Federal Trade Commission (FTC) reports the number of complaints it receives from Americans about unwanted calls and the value of scams that consumers say were initiated by phone call.
The reported figures for Q4 2025 should be ignored. They are unrepresentative because the shutdown of the US government that occurred between 1 October and 12 November interfered with the collection of data by government agencies. The affected period is highlighted on the chart.
Source: US Federal Trade Commission
Last updated 1 August 2026

The Federal Trade Commission (FTC) reports the value of scams that consumers say were initiated by phone call or by SMS message.
The reported figures for Q4 2025 should be ignored. They are unrepresentative because the shutdown of the US government that occurred between 1 October and 12 November interfered with the collection of data by government agencies. The affected period is highlighted on the chart.
Source: US Federal Trade Commission
Last updated 29 July 2026

Pew Research Center is a respected nonpartisan think tank that conducts unusually large and authoritative surveys of the American public. Their 2025 survey on "Online Scams and Attacks in America Today" asked US adults how often they receive calls or text messages they believe to be scams that attempted to obtain their personal information. This chart reproduces the results from the survey about the proportion of Americans who reported that they receive suspected scam calls or texts on at least a weekly basis.
Source: Pew Research Center

YouMail supplies data analytics software and services that extrapolates from data collected from the phones of its customers in the USA to assess whether an inbound call will be wanted or not. They use this data to produce an estimate of the total number of robocalls received by Americans, which they refer to as their 'Robocall Index'. The statistic has often been cited by the US Federal Communications Commission and others when expressing opinions about the number and trends for unwanted calls.
For several years there remained a widespread tendency for multiple parties to verbally describe the trend for the Robocall Index as downward despite the actual numbers showing the trend was upwards. The recurring nature of this misinformation about the Robocall Index inspired the creation of the Commsrisk Global Fraud Dashboard as an objective summary of trends.
This graph presents YouMail's monthly estimates for the number of robocalls received by Americans and the trend line since July 2021, the first complete month after STIR/SHAKEN became mandatory for US comms providers.
Source: YouMail
Last updated 2 October 2026

YouMail supplies data analytics software and services that extrapolates from data collected from the phones of its customers to estimate the total number of robocalls received by Americans, which they refer to as their 'Robocall Index'. The statistic has often been cited by the US Federal Communications Commission and others when expressing opinions about the number and trends for unwanted calls. Between 2021 and 2025, YouMail also regularly published press releases that estimated how many of the calls in its Robocall Index were scams, as opposed to other illegal calls or legal spam calls. This graph compares the Robocall Index total since July 2021 with the estimate of the scam subset until YouMail discontinued the reporting of its scam call estimates in mid-2025.
Source: YouMail
Last updated 2 October 2026

The Federal Trade Commission (FTC) reports the value of scams that consumers say were initiated by phone call. YouMail supplies data analytics software and services that extrapolates from data collected from the phones of its customers to estimate the total number of robocalls received by Americans, which they refer to as their 'Robocall Index'. Between 2021 and 2025, YouMail regularly published press releases that estimated how many of the calls in its Robocall Index were scams, as opposed to other illegal calls or legal spam calls. This graph compares the trends in those figures until YouMail discontinued the reporting of its scam call estimates in mid-2025.
For several years, numerous parties cited YouMail's figures as evidence that anti-scam policies had been effective. We present this graph to highlight a contrasting statistic that was equally available but which received less attention because it conflicted with the narrative of success.
Source: YouMail, US Federal Trade Commission
Last updated 8 April 2026

Thousands of comms providers are obliged to submit entries to the Robocall Mitigation Database (RMD) maintained by the US Federal Communications Commission (FCC) although it is unknown how many fail to satisfy this obligation, especially as the requirement can apply to comms providers headquartered outside of the USA. Examination of the entries also indicates that some RMD entries are from comms providers and other businesses that are not required to make submissions. The entire database is always available for download from the FCC's website because comms providers are supposed to only terminate calls within the USA if they come from a carrier with an RMD entry, and these entries may be added to, removed or amended at any time.
Commsrisk downloads the RMD database each week to analyze how many entries have changed since the previous download. This graph shows the total number of RMD entries per each weekly download. It highlights the number of additions and deletions of entries as well as the number of entries that were amended.
There were no changes to the contents of the RMD between 1 October and 12 November 2025 because of the US government shutdown, so this part of the graph should be considered unrepresentative of trends in the number of entities registering and deregistering.
Source: Commsrisk weekly download and analysis of the US Robocall Mitigation Database from the US Federal Communications Commission website
Last updated 19 May 2025
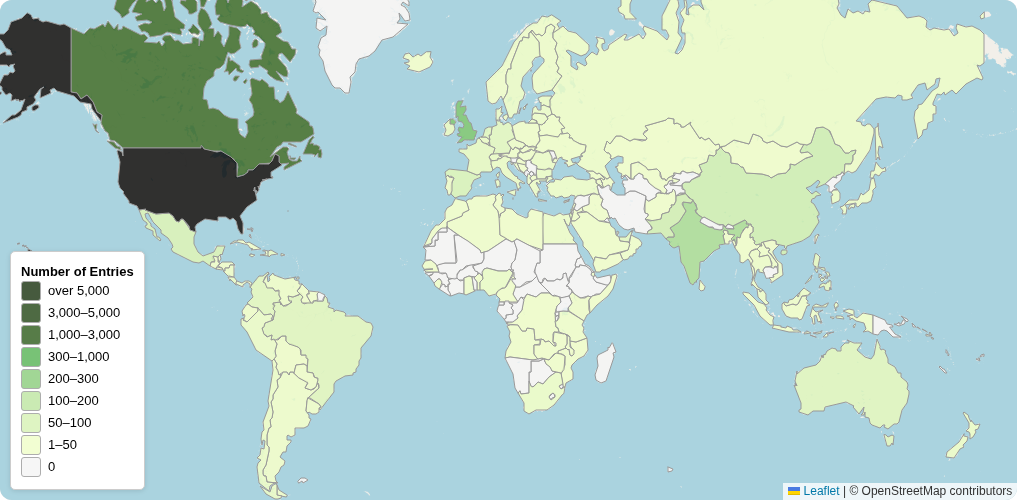
Thousands of comms providers are obliged to submit entries to the Robocall Mitigation Database (RMD) maintained by the US Federal Communications Commission (FCC) although it is unknown how many fail to satisfy this obligation, especially as the requirement can apply to comms providers headquartered outside of the USA. Examination of the entries also indicates that some RMD entries are from comms providers and other businesses that are not required to make submissions. The entire database is always available for download from the FCC's website because comms providers are supposed to only terminate calls within the USA if they come from a carrier with an RMD entry, and these entries may be added to, removed or amended at any time.
Commsrisk downloads the RMD database each week and analyzes the number of entries based on the country of the registrant. This heatmap shows the number of registrations from each country per the most recent download.
Source: Commsrisk weekly download and analysis of the US Robocall Mitigation Database from the US Federal Communications Commission website
Last updated 19 May 2025

TransNexus is a supplier of STIR/SHAKEN services to several hundred US comms providers. This gives them visibility of SHAKEN signatures attached to the voice calls received from over 1,000 other comms providers. Each month they report metrics on the proportion of calls received with SHAKEN signatures and the attestation levels of those signatures.
This graph shows monthly ratios of calls received with an intact SHAKEN signature to calls received without an intact SHAKEN signature.
Source: TransNexus
Last updated 7 October 2026

TransNexus is a supplier of STIR/SHAKEN services to several hundred US comms providers. This gives them visibility of SHAKEN signatures attached to the voice calls received from over 1,000 other comms providers. Each month they report metrics on the proportion of calls received with SHAKEN signatures and the attestation levels of those signatures.
This graph shows monthly ratios of the attestation levels (A, B or C) for calls received with a SHAKEN signature.
Source: TransNexus
Last updated 7 October 2026

Numerous US entities can request that calls are traced by the US Industry Traceback Group (ITG). There are typically less than 2,000 call traces attempted by the ITG each quarter. A high-level quarterly summary of the results of these call traces is given to the US Federal Communications Commission (FCC). This summary is published by the FCC several months after the end of each quarter. However, this graph has not been updated since April 2025, apparently because the practice of publishing 'transparency reports' has been discontinued. This would be consistent with the leaders not liking Commsrisk reading the reports and pointing out how often their interpretation of the contents is inconsistent with what the data actually shows.
The summary categorizes traces according to whether they were successfully traced to an originating telco in the USA (labeled 'ORG'), successfully traced to an originating telco outside of the USA ('IOR'), or was not completed because a telco was not responsive to a request for information ('NR'). Each trace is given a sequential reference number but the results of some traces are deliberately omitted from the summary report, as evident by the absence of reference numbers in the reported sequence. It is hence possible to count the number of unreported traces conducted by the ITG. No satisfactory explanation is given for the omission of traces from the report.
Source: Reports of the US Industry Traceback Group as published by the US Federal Communications Commission until this practice was discontinued
Last updated 4 April 2025

After adjusting for the relative size of each population, this chart compares the annual number of complaints about scam calls reported to the Australian Communication and Media Authority (ACMA) with the number of scam cases investigated by the Singapore Police Force that were initiated by a call.
Sources: Australian Communications and Media Authority and Singapore Police Force
Last updated 16 April 2026

After adjusting for the relative size of each population, this chart compares the annual number of complaints about scam SMS messages reported to the Australian Communication and Media Authority (ACMA) with the number of scam cases investigated by the Singapore Police Force that were initiated by an SMS message.
Sources: Australian Communications and Media Authority and Singapore Police Force
Last updated 16 April 2026

After adjusting for the relative size of each population, this chart compares the combined number of complaints about scam calls and SMS messages reported to the Australian Communication and Media Authority (ACMA) with the number of scam cases investigated by the Singapore Police Force that were initiated by either a call or an SMS message.
Sources: Australian Communications and Media Authority and Singapore Police Force
Last updated 16 April 2026

The Australian Communications and Media Authority (ACMA) and the UK Information Commissioner's Office (ICO) both receive complaints from the public about unwanted calls and SMS messages.
This chart adjusts for the difference in population by showing the number of complaints received per million inhabitants of each country. UK monthly data has been aggregated into quarters to match Australia's quarterly reporting. Quarters follow the Western calendar year: Q1 Jan-Mar, Q2 Apr-Jun, etc.
Sources: Australian Communications and Media Authority and UK Information Commissioner's Office
Last updated 16 September 2026

The Australian Communications and Media Authority (ACMA) and the UK Information Commissioner's Office (ICO) both receive complaints from the public about unwanted calls and SMS messages.
This chart is indexed to Q1 2020 (or the first available quarter if Q1 2020 is not available) to show the relative change in the number of complaints about calls since then. All figures have been normalized so that the equivalent statistic for the baseline quarter would be equal to 100. UK monthly data has been aggregated into quarters to match Australia's quarterly reporting. Quarters follow the Western calendar year: Q1 Jan-Mar, Q2 Apr-Jun, etc.
Sources: Australian Communications and Media Authority and UK Information Commissioner's Office
Last updated 16 September 2026

The Australian Communications and Media Authority (ACMA) and the UK Information Commissioner's Office (ICO) both receive complaints from the public about unwanted calls and SMS messages.
This chart is indexed to Q1 2020 (or the first available quarter if Q1 2020 is not available) to show the relative change in the number of complaints about SMS since then. All figures have been normalized so that the equivalent statistic for the baseline quarter would be equal to 100. UK monthly data has been aggregated into quarters to match Australia's quarterly reporting. Quarters follow the Western calendar year: Q1 Jan-Mar, Q2 Apr-Jun, etc.
Sources: Australian Communications and Media Authority and UK Information Commissioner's Office
Last updated 16 September 2026

The Australian Communications and Media Authority (ACMA), the UK Information Commissioner's Office (ICO) and the US Federal Trade Commission (FTC) all receive complaints from the public about unwanted calls.
This chart adjusts for the difference in population by showing the number of complaints received per million inhabitants of each country.
The reported FTC figure for Q4 2025 should be ignored. It is unrepresentative because the US government shutdown from 1 October to 12 November interfered with data collection. The affected period is highlighted on the chart.
Sources: Australian Communications and Media Authority, UK Information Commissioner's Office, US Federal Trade Commission
Last updated 16 September 2026

The Australian Communications and Media Authority (ACMA), the UK Information Commissioner's Office (ICO) and the US Federal Trade Commission (FTC) all receive complaints from the public about unwanted calls.
This chart is indexed to Q1 2020 to show the relative change in the number of complaints since then. All figures have been normalized so that the equivalent statistic for Q1 2020 would be equal to 100.
The reported FTC figure for Q4 2025 should be ignored. It is unrepresentative because the US government shutdown from 1 October to 12 November interfered with data collection. The affected period is highlighted on the chart.
Sources: Australian Communications and Media Authority, UK Information Commissioner's Office, US Federal Trade Commission
Last updated 16 September 2026

This chart compares the nominal quarterly value of scam losses initiated by calls and text messages in Australia and the USA, as reported by the public to Scamwatch and the US Federal Trade Commission, after adjusting for population size (USD per thousand people).
Scamwatch losses are reported in Australian dollars and converted to US dollars for comparability.
The reported FTC figures for Q4 2025 should be ignored. They are unrepresentative because the US government shutdown from 1 October to 12 November interfered with data collection. The affected period is highlighted on the chart.
Sources: Australia Scamwatch and US Federal Trade Commission
Last updated 29 July 2026

This chart shows, for each quarter, the ratio of scam losses initiated by phone calls to scam losses initiated by text messages in Australia and the USA, after adjusting for population size.
A value greater than 1 means more money is lost to call‑initiated scams than to text‑initiated scams, whilst a value below 1 means more is lost to scams initiated by text messages.
Scamwatch losses are reported in Australian dollars and converted to US dollars for comparability.
The reported FTC figures for Q4 2025 should be ignored. They are unrepresentative because the US government shutdown from 1 October to 12 November interfered with data collection. The affected period is highlighted on the chart.
Sources: Australia Scamwatch and US Federal Trade Commission
Last updated 29 July 2026

After adjusting for the size of each country's population, this graph compares the number of WhatsApp accounts taken out of service in India because they were abusing the company's policies with the number of WhatsApp accounts taken out of service in Singapore by order of the Singaporean police.
India is unusual in requiring WhatsApp to publicly report on the number of accounts it bans each month because of abuses, which will typically involve scams or spam. Singapore is unusual in having a police force that reports annually on the number of WhatsApp accounts it has disrupted, mostly due to scams. Obtaining figures for scam activity on WhatsApp from around the world is difficult because scams conducted using over-the-top communications services are often outside of the scope of most national communications regulators, will lie beyond the expertise of police, and are difficult to independently monitor because of the way they work in practice.
Sources: WhatsApp and Singapore Police Force
Last updated 25 March 2026

This graph compares the proportionate change in the number of WhatsApp accounts taken out of service in India because they were abusing the company's policies with the number of WhatsApp accounts taken out of service in Singapore by order of the Singaporean police. Figures are indexed against a baseline of 2023.
India is unusual in requiring WhatsApp to publicly report on the number of accounts it bans each month because of abuses, which will typically involve scams or spam. Singapore is unusual in having a police force that reports annually on the number of WhatsApp accounts it has disrupted, mostly due to scams. Obtaining figures for scam activity on WhatsApp from around the world is difficult because scams conducted using over-the-top communications services are often outside of the scope of most national communications regulators, will lie beyond the expertise of police, and are difficult to independently monitor because of the way they work in practice.
Sources: WhatsApp and Singapore Police Force
Last updated 25 March 2026

The UK Information Commissioner's Office (ICO) and the US Federal Trade Commission (FTC) both receive complaints from the public about unwanted calls and they use synonymous definitions for the distinction between live and automated calls.
This chart adjusts for the difference in population by showing the number of complaints received per million inhabitants of each country.
The total number of complaints for the USA does not equal the sum of the number of complaints about live and automated calls because flaws in the collection of complaints data means the distinction between live and automated calls is not captured for a non-trivial portion of complaints reported to the FTC.
Reported FTC figures for October and November 2025 are unrepresentative because the US government shutdown from 1 October to 12 November interfered with data collection.
As of the date of writing, Americans are far more likely to complain about unwanted calls than Brits.
Sources: UK Information Commissioner's Office and US Federal Trade Commission
Last updated 1 October 2026

The UK Information Commissioner's Office (ICO) and the US Federal Trade Commission (FTC) both receive complaints from the public about unwanted calls and they use synonymous definitions for the distinction between live and automated calls.
This chart is indexed to January 2020 to show the relative change in the number of complaints since then. All figures have been normalized so that the equivalent statistic for January 2020 would be equal to 100.
The total number of complaints for the USA does not equal the sum of the number of complaints about live and automated calls because flaws in the collection of complaints data means the distinction between live and automated calls is not captured for a non-trivial portion of complaints reported to the FTC.
Reported FTC figures for October and November 2025 are unrepresentative because the US government shutdown from 1 October to 12 November interfered with data collection.
As of the date of writing, both countries have made more progress with reducing complaints about robocalls than reducing complaints about live calls.
Sources: UK Information Commissioner's Office and US Federal Trade Commission
Last updated 1 October 2026
The Commsrisk Global Fraud Dashboard is made possible by the generosity of our donors. They are:

Articles copyright © the author, all else copyright © Revenue Protect Limited