Automating the collection of data and systematically presenting it via our new Global Fraud Dashboard has made my life less complicated, but only because I spend a lot of time checking facts. Life would be even easier if I simply repeated what other people say. Life would be easier, but wrong. Trusting misinformation predictably leads to bad outcomes. But I do not need to tell you that; the wise readers of Commsrisk come here because they seek an antidote to the misinformation being pushed elsewhere.
The evaluation of policies should be based on results. However, it is rare to find examples of the comms sector performing systematic evaluations of anti-fraud policies in practice. An excess of politics and lobbying have delivered a lot of bad policies over the years. Fraudsters are not the only people to blame for sky-high levels of fraud. That is why the authorities in countries like Australia and Ireland deserve praise for the effort they have put into quantifying the extent to which different policies can reduce fraud. We tried to think of ways Commsrisk might follow their example by encouraging good data-driven policymaking. Now we are doing it by mining information resources that were already available, but which were not being brought together for easy comparison. We thank the many visitors to the dashboard since its launch. It is our intention to add new charts each month. This will give policymakers even more opportunity to use data to inform their decisions.
Sadly, there will always be scoundrels who conclude that night is day and that rain is dry, even if the raw data indicates otherwise. I have lost count of the number of times when some people have squinted at a graph and imagined themselves looking at a trend line that points downwards when plainly it was pointing upwards, or vice versa. That is why the Global Fraud Dashboard also needs to be complemented by some kind of regular commentary on the latest updates. Welcome to the first installment. Future installments will be published around the middle of each month.
New Graph Shows Sustained Rise in Americans Complaining about Unwanted Robocalls Since the Beginning of 2025
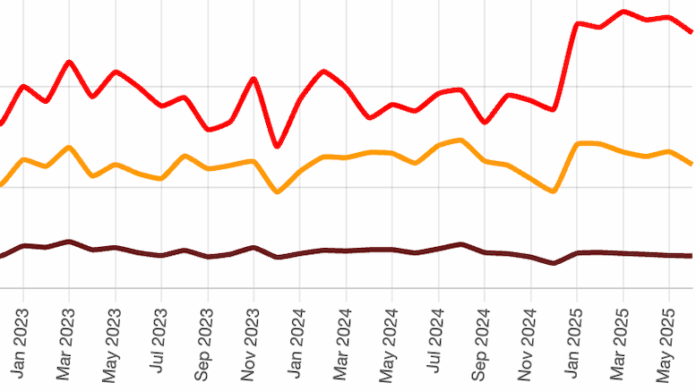
The US Federal Trade Commission (FTC) supposedly has an API to report statistics about consumer complaints but it seems to be permanently offline. That slowed us down, but it did not prevent us scraping the same data another way. The FTC’s data is now feeding a new automated graph that shows the number of complaints that Americans make about nuisance calls they have received. From this graph we can plainly see the following.
- From January 2023 to December 2024, the number of complaints about robocalls remained within in a band that ranged from 112,000 complaints in the worst month to 70,000 complaints in the best month, delivering a mean average of 93,700. Complaints figures underwent a clear shift to a higher band in January 2025 and have remained there. Since the beginning of the year, the monthly average has exceeded 132,000 complaints, a rise of over 40%.
- There was also a noticeable, though smaller rise in the number of complaints about live calls between December 2024 and January 2025.
- Distinguishing between robocalls and live calls is important because a control that might reduce one may prove ineffective against the other. However, the FTC does not help themselves by gathering data in a way that means 10% of complaints in a typical month will not specify if the call was live or automated.
The takeaways are as follows.
- Comments about the impact of US consumer protection policies on robocalls tend to be misleading because they refer to ‘the’ trend in the number of consumer complaints when there have been multiple distinct trends over the last five years. There was a sharp downward trend from the peak number of robocall complaints in March 2021 until the end of 2022. The trend was flat through 2023 and 2024. The rate for new robocall complaints jumped upwards at the beginning of 2025, and has since remained flat at that new level. This means that any policy successes inferred from the reduction in complaints that occurred prior to 2023 have not continued to reduce unwanted robocalls. The jump in the rate of new complaints since the beginning of 2025 suggests a need to revise policies to restore downward pressure on nuisance robocalls.
- Americans have always made more complaints about robocalls than live calls, so there is a tendency to ignore the trend line for live calls when discussing the trends for the total number of complaints about unwanted calls. Overall, the number of complaints for live calls has been broadly flat for a long time, with only a marginal improvement noticeable across a period of several years. This begs the question of whether US policy is too heavily focused on automated controls that detect and block highly repetitive and predictable automated calls at the expense of policies that would tackle the live scam calls which are more likely to induce victims to lose money.
- The eagerness with which some parties jump to conclusions based on changes in the total number of complaints contrasts sharply with a lack of interest in addressing weaknesses with the data used to assess the effectiveness of policies, most especially with respect to whether a complaint is about a live call or an automated call.
For this new graph, we went back and mined all the FTC’s data since January 2020. We intend to use this date as a common baseline as we begin to construct automated graphs that compare trends in consumer complaints from multiple countries. This will help to distinguish between the impact of a policy only pursued in one country with factors that are common to multiple countries. For example, if multiple countries all exhibit a sharp rise in complaints during the same month then this would suggest a change in behavior by parties that place large numbers of outbound international calls, not a change in the implementation of national filters on inbound international calls.
The Same Graph, but for the UK
If viewed in isolation, it would not be worth commenting on recent trends in complaints about unwanted robocalls in the UK. However, the number of Brits complaining about robocalls in recent months is at the high end of the range observed since 2022. If this continues in subsequent months then it could mean there is some commonality with the factors that have also prompted the rise in complaints in the USA.
However, the UK’s established pattern of complaints differs from that in the USA because Brits are more likely to complain about live calls than robocalls. This is the reverse of the pattern seen in the USA. American political pressure to introduce automated international controls on robocalls should not distract from the UK placing a higher priority on protecting consumers from unwanted live calls.
SMS Blasters Found in More Countries
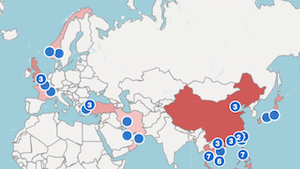
People who rely on the mainstream press to learn about the ‘new’ crime of smishing messages being sent by fake base stations will know one person was arrested in New Zealand in 2024, several people have been arrested in the UK, and stuff has happened in Thailand. You have probably seen our SMS blaster map so you know how many other countries have reported cases of fake base stations being used to send SMS messages this year, as well as knowing how old this phenomenon is. Recent additions to the map include cases in Japan, Qatar, Oman, Iran, Türkiye and Indonesia.
The Steady Rhythm of New Ransomware Attacks
Delays in reporting new ransomware attacks vary quite a lot, but our chart of the global number of ransomware attacks on comms providers has settled into a pattern where the average is more than one new attack per week.
WhatsApp Keeps Setting New Records for the Number of Indian Accounts Banned
A lot of anecdotal evidence suggests scammers increasingly prefer WhatsApp to traditional voice calls and messaging channels. The most recent data from India set another new record for the number of WhatsApp accounts banned in a month.
More on US Robocalls and STIR/SHAKEN
The total number of US robocalls per YouMail’s Robocall Index dropped closer to the long-term average during June after reporting elevated levels between March and May. But that does not mean the US implementation of STIR/SHAKEN deserves the credit; TransNexus reported yet another fall in the number of calls completed with a SHAKEN signature. If the current trend continues, then their metric for calls with a SHAKEN signature at destination will soon fall below 40% again, having never broken the 50% threshold that it almost reached in 2024.
Coming Next
It would be tempting to keep focusing our efforts on US data. There is a lot of misinformation about US policy, and it is easier to see why after examining more of the data sources that Commsrisk could potentially incorporate into automated charts. The USA produces more data than other countries, but as we look at more sources we find more conflicts between them. Apparent contradictions will encourage cherrypicking by less scrupulous commentators; they can literally select whichever sources of data best support the conclusions they want to reach. However, consumer complaints is one of the most abused sources of data worldwide, as well as being one of the most common types of data available for comparison between countries. We are going to prioritize the creation of new graphs that extend the work done on US and UK complaints by introducing comparisons between them and the complaints data reported by other countries. There are downsides to relying on measures based on reports from the general public, but I hope that some of those drawbacks can be mitigated by comparing the trends seen in different countries. For example, what may appear to be a big improvement when looked at in isolation could look mediocre when compared to more dramatic shifts in the pattern of complaints seen elsewhere.